Release notes
This article documents the ongoing releases of Cognite Data Fusion (CDF) features and products.
April 2024
Cognite is moving to a quarterly release cadence. The next main release is scheduled for June 2024.
New and updated features
Cognite Data Fusion
In Charts:
-
To assess monitoring jobs, use Alerts in selected time frame. This section displays the number of alerts that would have been triggered based on your settings. Use this info to determine appropriate alert threshold values. (Beta)
-
For a detailed view of time series values at a specific moment, select Slider from the tools menu. Use this setting to compare different time points and observe trend changes.
-
The maximum number of raw data points in a chart increases from 500 to 100,000.
On Canvas:
-
We're introducing a new user experience for finding and adding data to a canvas. Select Add data, enter a query in the search field, then use the left sidebar to filter the search results by category and the Filters button to refine each category. This user experience aligns with how you find data in CDF.
-
To collaborate with colleagues who haven't signed in to CDF, share your canvas by entering their email address under Share. They'll get an email invitation with a link to the canvas, and will need to authenticate to get access.
In Search:
The features described in this section are currently in beta testing and are subject to change.
-
Sort names or counts in ascending or descending order (
 ) in the search results, in the list of categories, and on the data on the search details pages.
 -
The sidebar has two sections: a set of default categories that apply to all data models, and a list with other categories that adapt to each company's specific data model.
-
If you search using Copilot, it identifies relevant categories and applies filters to the search results. You can modify the filters or select a different category to adjust the results.
-
To visualize data on an X- and Y-axis, select the statistics icon on the Copilot results page. Note that this feature is only available for the categories listed under Other categories.
For setting up 3D content:
Set thresholds for your 3D environment to highlight important attributes or criteria and identify patterns and anomalies in your scenes. Visualize the thresholds in the 3D scene by applying a color overlay.
For access management:
We're introducing group membership within groups in Manage Access.
To give access, admins previously had to create groups in their IdP, add users to these groups, and then link the IdP groups to groups in CDF. Now, admins can directly add users to groups within CDF, streamlining the access management process. You can also use this feature when you create or edit a group.
When you've added the required capabilities to the group, select an option under members:
- Externally managed: Provide the group ID of a group with users in your IdP. This is the existing solution.
- List of users lets you add and remove users. The listed users will have access given by the capabilities in the group.
- All user accounts gives access to capabilities in the group for all user accounts in the organization. Use this option carefully, it may lead to unintended access granted to every user in the organization.
For data onboarding:
-
Use the new Cognite Kafka extractor to extract data from Apache Kafka.(Beta)
-
Use the Cognite File extractor to extract documents from OpenText Documentum and OpenText Documentum D2. You'll also find these improvements to the file extractor:
- In the configuration file:
- Use the new
filtersection for advanced filtering logic. - Use the new
delete-behaviorsection to detect hard or soft-deleted files. - Use the new
metadata-to-rawsection to ingest file metadata to a table in CDF RAW.
- Use the new
- For connections to Sharepoint Online sites:
- Connect to multiple sites using the
pathsparameters. - Configure sites by pasting the URL directly into the configuration file.
- Dynamically discover sites by adding several sites to the
filtersection.
- Connect to multiple sites using the
- The file extractor now supports ingesting files larger than 5 GiB.
- In the configuration file:
InField
The features described in this section are currently in beta testing and are subject to change.
- Manage columns. Customize the Overview page.
Add, hide, or rearrange the columns to view the information that's more relevant to you.
-
Work order details. Combined the Assets and Operations tabs.
Now, you can find information about assets and tasks to be performed under one tab. Open work order details and select the Operations tab to see field workers' tasks and the work center information. Expand the task to see if it applies to several assets. -
Overview filters. Save your favorite filters and use them as default.
On the Overview page, use filters to get the most relevant data and save the filter selection to use next time. You can apply one of the saved filters based on your needs or set the filter as default.
InRobot
The features described in this section are currently in beta testing and are subject to change.
- Robot selection. Select a robot when needed.
Before, you had to select a robot when you started using the application or switched from one tab to another. Now, the robot you used the last time will be selected automatically, and you can switch the robot at any time.
Resolved issues and minor updates
-
Filter settings are kept while you browse the details tab in Data Explorer and Search.
-
The filtering logic for
AndandORoperations are adjusted in the Data Explorer.
Deprecated and retired features
-
Cognite Documentum extractoris deprecated from April 2, 2024, and will also be retired from April 2, 2024. Support for OpenText Documentum and OpenText Documentum D2 has been integrated intoCognite File extractor. -
Support for Python 3.8 as the default Python runtime in
Cognite Functionsis deprecated from March 11, 2024 and will be retired from October 1, 2024. The default Python runtime inCognite Functionsis updated to version 3.11.
See also: Overview of deprecated and retired features.
March 2024
Watch the summary in the product release spotlight.
New and updated features
Cognite Data Fusion
On the Canvas:
-
Add charts to your canvas from the Add data option on the canvas or from Open in Industrial canvas on a chart. The chart on the canvas includes any threshold values and time series calculations. To edit a chart, select Open in Charts from a time series. (Beta)
-
Create plans and diagrams, such as cause map diagrams, by adding sticky notes using the dots around an existing sticky on the canvas. Drag a dot to create lines between the sticky notes. (Beta)
In Search:
-
If you browse a 3D model from the search page, you'll find additional options for navigation and visualization:
-
Orbit mode: Rotate around objects to see all sides.
-
Fly mode: Look around the exterior or interior of a closed room.
-
Move instantly to any spot by double-clicking anywhere in the 3D model.
-
Color overlay: Use this option on the toolbar to highlight objects on the model. Your CDF admin predefines the options on this list. (Privat beta)
-
For data onboarding:
-
Data workflows is a new managed process orchestration service to coordinate interdependent processes, such as CDF Transformations, Cognite Functions, requests to the CDF APIs, and other data processes. (Beta)
-
By aligning all 3D content, such as point clouds and CAD models, in a location, the users will get better context and understanding of the physical conditions of a location. You do this by configuring a 3D scene under Set up 3D content. You need a scene to view 3D models from the search page.
-
Run CDF Transformations incrementally for transformations that read data from a CDF data model. CDF will only read and transform data that has changed since the last run. (Coming soon)
-
Assign units from the CDF unit catalog to time series instances and to
float32andfloat64base type for data models. For unit-aware time series and data modeling properties, you can request unit information and consume data in a compatible unit. CDF handles the unit conversion automatically. -
If you're modeling data using the CDF user interface, you can now see how relationships of data is stored in containers, what data can be queried (the views/data models), how graphs are constructed (containers), the relationships between data objects (edges and direct relations), and how these are consumed (from views and data models) by queries.
-
In-product guides are available for onboarding new users to
Chartsand the 3D view on the search page.
For time series:
-
Subscribe to one or multiple time series to automatically obtain the latest data points or changes to data points for one or more time series. This is useful if you keep a chart or a dashboard up to date with the latest time series values or need data points to perform calculations.
-
Time series data points now display data quality status codes to help you determine how to treat uncertain data points and better visualize data when you're plotting data points in a chart. The implementation follows the OPC UA standard, and both the Cognite OPC UA and PI extractors support this feature. (Beta)
Jupyter Notebooks
-
Open Jupyter Notebook directly from the CDF staging area (RAW) and the data model user interface. (Beta)
-
Jupyter Notebook copilot is improved, and better understands CDF and the Cognite Python SDK. (Beta)
New Python data modeling SDK generator
- We're introducing Pygen, a Python data modeling SDK generator. Pygen is a Python package and a command-line interface for generating Python SDKs from CDF data models. (Beta)
InField
The features described in this section are currently in beta testing and are subject to change.
-
Conditions. Set conditions to tasks.
Add actions for the field workers to perform depending on the task state. In the first implementation, you can show a message with instructions, questions, etc. when adding a template task. -
Device mode. Set a default mode for
InField.
Switch to a mobile or a desktop version of the application on your device and make it the default. The setting doesn't affect the mode of other devices. -
Overview filters. Search and filter the Overview page.
Search for checklists and work orders by name and filter on the checklist status. -
Checklist date. View the checklist creation date.
In the list of checklists, check the date when each checklist was created, along with the day of the week and time. -
Schedule. Add monthly and yearly intervals.
Create daily, weekly, monthly, and yearly schedules for checklists to perform at regular intervals. -
Templates. Hide the templates list.
Hide the panel with the list of all created templates while creating a template, adding tasks, and viewing asset information. -
Offline mode. Improved data storage.
If the users have a slow internet connection for more than 5 seconds, the application switches to offline mode. Users can upload the data when the connection is back. -
Observations. Updated observations type and priority.
Select a priority option from 1: Immediate to 5: Greater than 8 weeks and one of 5 observation types (M1, M2, M4, M5, M8).
InRobot
The features described in this section are currently in beta testing and are subject to change.
-
Video. Record videos of up to 60 seconds of assets in motion. For example, record a video of a water pump to see the water flow.
-
Waypoints. See the direction of the robot’s movements on the 3D map with the help of cone-shaped waypoints.
-
Move map to model. Move the waypoints to the 3D model. Adjust the position of waypoints if needed.
-
Media preview. In Reports, see which runs include images and videos.
-
Filter missions. In Reports, search a mission by name to find the mission of your interest faster.
Resolved issues and minor updates
Cognite Data Fusion
In Charts:
-
If you manually set the range of an axis, an indicator and a button appears where you can reset to automatic range mode.
-
Function descriptions are now available in all the languages CDF support.
On the Canvas:
- You can now paste local files directly onto the Canvas using Ctrl + V (
Windows) or Cmd + V (macOS).
In search:
-
If you're using CDF in Japanese, the kana-kanji conversion now works correctly.
-
The related asset count on the asset details page now shows all related assets. Previously, this count had a limit at 1000.
-
Search for events using metadata ID is improved.
InField
In InField, we've resolved these issues:
-
You won’t see information about a previously selected asset when switching from one checklist to another.
-
After the mobile users enter a numerical value, the application won’t jump to the next numerical reading and skip the tasks in between.
-
When adding a description to an observation, the users will stay on the same step unless they select the next or previous step.
Deprecated and retired features
See Overview of deprecated and retired features.
Cognite API updates
To see changes to the Cognite API, visit the API changelog.
January 2024
Watch the summary in the product release spotlight.
New and updated features
Cognite Data Fusion
-
We're introducing in-product tours to help new users get started using CDF. The tours start automatically the first time you open the CDF homepage, the
Searchpage, theCanvas, andInField. -
You can now access
Data Explorer,Canvas, andChartsdirectly from the updated CDF homepage. Select Data management to see data engineering and administrative features. -
On the
Canvas:-
See and restore previous versions of your canvases from Open canvas history. Canvas checks for updates and stores a new version every 5 minutes. You can't edit previous canvas versions.
-
You'll receive an email with a link to the canvas if a colleague mentions you in a comment.
-
The toolbar has new shapes for industrial data.
-
Lock a canvas to prevent unwanted changes with the Lock canvas option under the ... icon.
-
Select the copilot (
 ) icon within a document to use AI to find or summarize information in the documents. (Beta).
-
-
If you subscribe to monitoring alerts in
Charts, the email notifications now include an investigation button that brings you directly to the chart and an option to unsubscribe to the emails. We've also made these improvements:-
Edit existing monitoring jobs with the new Edit button.
-
Select among multiple new colors for time series diagram lines.
-
Highlight the threshold line on a time series by clicking a monitoring job.
-
-
On the
Searchpage (Beta), we've made these improvements:-
The search results show directly linked data from the asset hierarchy data model and the CDF data model framework.
-
If you're using the asset hierarchy data model, contextualized data is based on relationships, annotations, and direct links.
-
If you're using the flexible data model framework, contextualized data is based on annotations to asset hierarchy resources, edges, direct relations, and strings references.
-
-
To continue analyzing and collaborating on the data, select Open in Industrial canvas from
Data ExplorerandSearch. -
If you open an engineering diagram in
Search, orange-colored boxes indicate links to other files. Purple-colored boxes indicate links to other data objects, such as additional information about equipment. -
Select the
Copilot() icon within a document to find or summarize information in the documents. (Beta).
-
-
In the 3D view on the
Searchpage, we've made these improvements:-
From the side panel, you can filter all 3D objects within a 3D model and the data directly linked to the 3D object, such as work orders and sensor data. The 3D objects are highlighted in the model and have a preview card with directly linked items.
-
On the preview card, you can open directly linked files, such as engineering diagrams, and see a file preview on top of the 3D object.
-
-
In CDF data modeling, the expressiveness of the industrial knowledge graph is extended with the new relation type
reverse direct relation. Defining types that have properties that are nodes pointing to the current type improves consistency and query ergonomics. -
The
Cognite SAP extractornow supports multiple SAP sources, SAP RFC and SOAP endpoints, multiple CDF resource type destinations, and multiple keys when ingesting to CDF RAW. Note also that the configuration schema is updated to support multiple SAP sources. -
Under
Match resources to asset, you'll find these changes in the user interface:-
On the Select source page in Quick match, the filtering options for data sets now only display the data sets containing the selected resource type.
-
On the Review results page in Quick match, you'll now see the current asset to which the resource is linked to alongside the suggested asset.
-
The 3D matching option is moved to the Select Source page, and you'll find 3D node among the resource types for selection.
-
-
When you upload 3D models to CDF, you can use AI to enhance point clouds with classifications and object detection. Navigate to Integrate > Upload 3D, then select the
 icon .
 -
We're introducing request and concurrency limits for the CDF RAW service.
-
Assign units to time series and numerical properties in data models. The industrial knowledge graph stores numerical data with associated units selected from the built-in unit catalog. Then, perform unit conversion on query time for time series data points, which saves you from having to handle conversion.
-
In the
Cognite JavaScript SDK, you can retrieve data points with granularity set as a month. -
The Industrial Data Science library is now open-source and open to external contributions. See https://github.com/cognitedata/indsl.
InField
The features described in this section are currently only available to selected customers.
-
Item to check. Add extra items to be checked to the task.
Describe what needs to be done and add alternative responses (action buttons). Each response can be linked to a task status. When working on the checklist, select the response with the linked status. The task status will automatically change to the status linked to the response. -
Bulk status change. Change the status of the remaining tasks in the checklist.
When working on a checklist, bulk change the statuses of the remaining tasks. You can do that for the tasks inside and outside the group and only once. -
Task description. Provide a description or step-by-step instructions to explain what field workers need to do when working on a checklist.
-
Observations. Provide asset observations.
Field workers can create observations when working on a checklist or by clicking the menu button > Create observation. -
Schedule. Formerly Task intervals.
Specify the start date for the checklist to open automatically and set your tasks to repeat on daily or weekly intervals. -
Message. Enter a message or a question that requires a reply.
Ask operators to write a response to your request, question, message, etc., when working on a checklist.
Resolved issues and minor updates
Cognite Data Fusion
-
In the
Data Explorer, we've resolved these issues:-
Resource types displayed a maximum of 100 linked items. Now, there are no maximum limits.
-
The results were not updated if you entered a value in the Internal IDs field under the Common filters sidebar.
-
If you initiated contextualization for files with assets and reran the contextualization without assets, the files would still be contextualized.
-
For some users, CDF would end if the asset hierarchy data model exceeded ~6.5k nested nodes.
-
-
In
Charts, we've resolved these issues:-
You could not create a monitoring job if you entered a float value in the Minimum duration field.
-
Unit texts are now adjusted to fit the table view.
-
-
In
InField, we've resolved these issues:-
You can now work on a checklist in offline mode on a tablet in landscape view.
-
Checklists didn't appear as scheduled.
-
Tasks disappeared when you tried to duplicate them.
-
Check item action buttons didn't appear in checklists.
-
-
In 3D models, end preparations on circular tubes didn't appear correctly.
Deprecated and retired features
Cognite Discover, along with the Well Data Layer (WDL), is deprecated from November 10, 2023, and will be retired from December 31, 2023. Document Search has been integrated intoData Explorer.
See also: Overview of deprecated and retired features.
Cognite API updates
To see changes to the Cognite API, visit the API changelog.
October 2023
New and updated features
Cognite Data Fusion
-
Use the new search on the CDF home page to find data for your daily tasks. The search results show all connected (contextualized) items to give the full context of your data. You can open the results directly on the
Industrial canvasorChartsfor further analysis and collaboration. (Beta)You can also find data using Cognite AI (artificial intelligence) for industrial data. Select the Search using AI tab to try one of the example questions or write your own. (Beta)
-
We've added several features to the
Industrial canvas. Copy content between canvases, duplicate canvases, and select which properties to show on asset cards. (Beta) -
In
Charts, create a calculation pipeline by saving, scheduling, and monitoring calculations. (Beta) -
In the
Data explorer:-
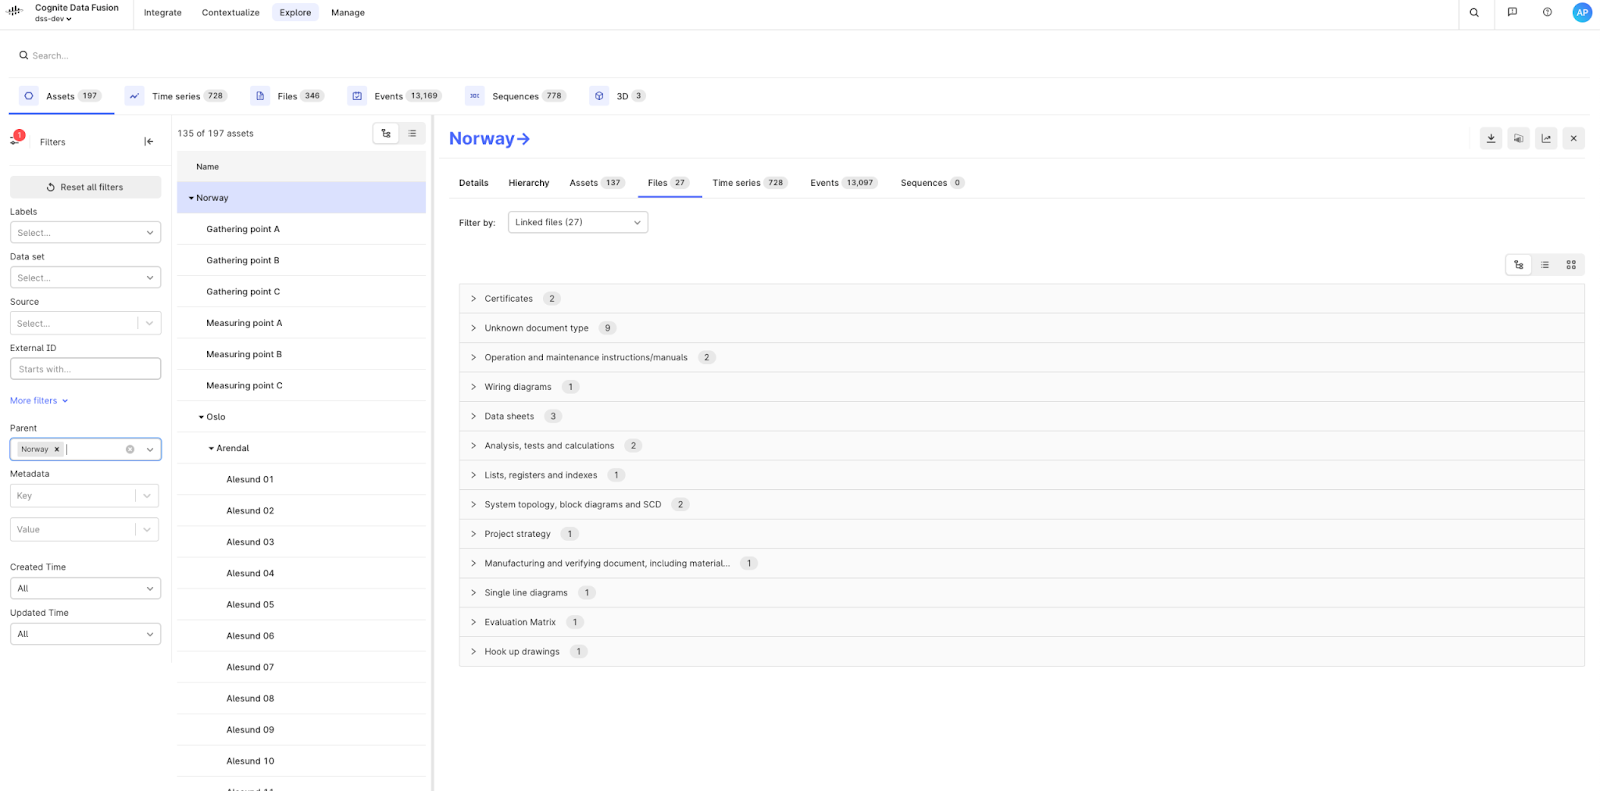
Filter assets, time series, files, events, and sequences by all linked resources, directly linked resources, and relationships. For assets and files, you can also filter by annotations.
-
Filter by Parent and Child under Assets in the sidebar.
-
-
Jupyter Notebook with AI copilot is now an integrated part of CDF. Use Cognite AI to write and understand code or explain scripts from others. Notebooks run in a sandboxed environment inside the browser using the current user credentials. You can share notebooks with your coworkers. (Beta)
-
To search for equipment using 3D models, admin users can manually link objects or areas in CAD models and point cloud models to equipment and update existing links between 3D objects and tags. (Beta)
-
The new Cognite OPC Classic extractor reads time series and asset information via the OPC DA and HDA protocols. (Beta)
-
User profiles are now generally available. When activated by a CDF admin, user profiles let users share data and mention their coworkers.
-
For Model your data, we've made these improvements:
-
When you open the code editor without being in edit mode, you'll find links to Preview data and Transform data above each data type.
-
In the Types section:
-
The Add type button is now located in the header panel.
-
Search for data types in the Search field.
-
Select Type or Interface when you add a type.
-
Each type is labeled with additional info, such as import and read-only directives.
-
-
In the GraphQL section, you can use the
@defaultdirective to set the default value for a property. For instance:type Pump { weight: Int @default(value: "5") }
-
InField
The updates and features are currently available to selected customers only.
-
Offline mode. Complete operator rounds and work orders without network connectivity.
Open the checklist on your mobile device before performing tasks, and if you go offline, you can still complete your tasks but with limitations. When offline, you can't access the asset explorer, upload media, or create observations.
InRobot
The updates and features are currently available to selected customers via the Early Adopter program.
-
Mission scheduling. Automate robot missions.
Plan single or recurring autonomous robot missions, set the date and time of the mission, or skip one of the scheduled mission runs.
-
Gauge details. View the gauge type and gauge values in the reports.
-
Gauge asset metadata. Edit the gauge asset metadata in reports to improve gauge reading functionality.
-
Time series access. Navigate from Reports to
Data Explorerto analyze time series.
Resolved issues and minor updates
Cognite Data Fusion
-
In the
Data explorer, we've resolved these issues:-
On the Asset tab:
-
If you select an asset, you automatically navigate to the same asset when you open the Hierarchy tab.
-
The asset hierarchy only displayed if the root asset was displayed on the first page of the results.
-
-
On the Files tab:
-
Some files were incorrectly linked to an asset.
-
If you added multiple tags to an engineering diagram, the Select button would show as deactivated.
-
-
On the Details tab:
- The Label field now displays the same name as in the source system.
-
-
On the
Industrial canvas, we've resolved these issues:-
When you add data to a canvas, the Load more button and the date selector for time series are easier to access.
-
If you added a rectangle around an engineering diagram, you couldn't interact with the annotations.
-
Lines didn't display correctly on the engineering diagrams.
-
-
In
Charts, we've resolved these issues:-
The chart now previews a threshold line when you configure a monitoring task.
-
If you monitor time series, the email alerts contain more context for threshold breaches.
-
-
In the Create interactive diagrams, we've resolved these issues:
-
When you selected a set of assets to link to a diagram, some assets were excluded as potential candidates. All selected assets are now considered for linking with the diagram.
-
When you linked to other engineering diagrams, More filters didn’t display all the values correctly.
-
-
On the CDF home page, we've resolved these issues:
- If you've worked with
ChartsandIndustrial canvas, these are now added to the Recent activity section.
- If you've worked with
-
For Access management, we've resolved these issues:
-
Some users got an incorrect Access required message when they signed in to CDF.
-
Access was denied if you closed CDF without signing out and then re-opened CDF with a URL address that included the CDF project.
-
-
For Model your data, we've resolved these issues:
-
If you created a data model using the CDF CLI, it wasn't possible to add a description.
-
On the Data management tab:
-
The knowledge graph icon didn't open GraphQL.
-
The instance count didn't show the correct numbers.
-
-
The scroll bar for selecting a relationship when you create a transformation didn't scroll.
-
The field name would disappear when you added a type.
-
Reference nodes didn't load correctly.
-
If you deleted a type from the code editor and switched to the list view, CDF stopped responding.
-
Changes to Cognite Functions on Google Cloud Platform
From February 1, 2024, the function call timeout will be changed from 15 to 9 minutes for projects running on Google Cloud Platform (GCP). Learn more.
Deprecated and retired features
Cognite Data Fusion
-
Automatic Identification and Reporting (AIR)is deprecated from October 6, 2023, and will be retired from December 31, 2023. The core functionality of AIR has been integrated intoCharts. -
Asset Data Insight (ADI)is deprecated from October 5, 2023, and will be retired from December 31, 2023.Charts,Industrial canvas, andData explorerare available through fusion.cognite.com to replace the key ADI workflows.
See also: Overview of deprecated and retired features.
Cognite API updates
To see changes to the Cognite API, visit the API changelog.
August 2023
Enhancements
-
Work in your preferred language in
InField,Maintain,Charts,Industrial Canvas, and theData Explorer. Navigate to Manage account on your user profile and select among the languages listed below. This feature is in Beta.Deutsch-English-Español-Français-Italiano-Nederlands-Norsk-Português-Svenska-한국어-中文-日本語 -
Collaborate on the data on a canvas, for example by entering comments and tagging co-workers. Select Share to give co-workers access to the canvas. This feature is in Beta.
-
You can now use data from your custom
CDFdata models inPower BI, and use GraphQL mutations to update your data model data. -
Use data point subscriptions to configure a subscription to listen to changes in one or more time series. A time series may be part of many subscriptions. Use this feature if you need to keep up to date with changes to one or more time series without re-ingesting the entire time series. See also the API documentation or try it out using the Python SDK. This feature is in Beta.
-
We're releasing the Cognite File Extractor into general availability and upgrading the Cognite DB Extractor to version 3 with the following enhancements:
-
Ingest data into the
CDFasset and event services by structuring the query to return keywords as column names. You can also write a table toCDFsequences, and if the database contains binary data, you can upload it toCDFfiles. -
Native support for databases, such as
PostgreSQL,Snowflake,Azure Cosmos DB, andMongoDB, means you can connect to the extractor without usingOpen Database Connectivity (ODBC)drivers. -
Schedule queries with cron expressions or intervals, for example,
6hor15m. Disable scheduling with a global configuration parameter while leaving theschedulekeyword in the query configuration, for instance, for debugging or manual runs.
-
-
Ingest data into
CDFusing theMQTTstreaming service~.Cognite's infrastructure hosts the extractor, and you configure the extractor usingCDFto connect to anMQTTbroker. You listen to data by subscribing to topic filters and specify the message format for the extractor to ingest data arriving on the configuredMQTTtopics. This feature is in Beta. -
In the
Cognite Python SDK, you can now use advanced search and filtering on metadata across events, time series, asset, and sequences, using the.filter()method, for example,client.events.filter. -
In
Cognite InRobot, you can:-
Pause/resume missions as you navigate the robot or when it performs missions autonomously.
-
Cancel missions, but pause the mission before you cancel it.
-
Review old and new images of inspection points on the Actions report.
-
The robot can return to the dock without the docking station in sight.
This feature is in Beta.
-
Limited availability
The features described in this section are currently only available to selected customers.
-
We're releasing new experiences for
Cognite Maintainand [Cognite InField]. This includes a new user interface and functionality for both applications to streamline theCogniteasset performance management offering. -
Create a calculation pipeline in
Chartsby scheduling and monitoring calculations. Use the option Save and schedule to set the run intervals. Set up monitoring of time series and calculations together. If a threshold is breached, subscribers will receive an email notification. Beta.
Deprecated features
- Starting September 1, 2023, we'll no longer develop new features for
Cognite Remote. See Deprecated and retired features for more information.
Resolved issues
-
For data transformations, we've resolved issue where long-running transformations timed out due to driver restart errors.
-
For the Cognite extractors, we've resolved an issue where some users experienced timeouts when running the
Cognite DB Extractor. Note that the recommended size of the upload queue is 50 000 rows and that thequeryparameter should contain awhereclause using the substitutions{incremental-field}and{start-at}if data is loaded incrementally. -
In the CDF data modeling framework, we've resolved these issues:
-
Some users got inconsistent results when listing data models using the
CDFUI and theCDF API. -
It wasn't possible to populate two or more views pointing to the same node using transformations.
-
CDF CLI, v2.3.0: The data model name and description were deleted when you published the data model.
-
-
In the
Data Explorer, we've resolved these issues:-
If you searched for a file from the
CDFhome page, you were directed to the file search in theData Explorer. Now, the file opens directly. -
Changes weren't kept when you created tags manually on an engineering diagram and selected an asset before you saved.
-
It wasn't possible to filter by relationship on the Files tab using the tree view.
-
Some customers were not able to search in the
Data Explorer. -
The filtering of resource labels didn't limit the labels according to the filtering.
-
The file number count for a document category and linked files weren't aligned.
-
The linked asset count on the File tab in the
Data Explorerand the count from theCognite SDKs weren't aligned.
-
June 2023
Enhancements
-
When you open the CDF portal application, you'll find a new home page with direct access to popular features. Select a card to open a feature or select View all to see all features.
-
Enhancements to the CDF data modeling framework include:
- Use the Browse library feature to select predefined data models you can tailor to your industry standards.
- Display time series data from CDF data models in the Grafana connector.
-
Enable user profiles to let users share data and @mention other users.
-
Extract data from SAP with the new Cognite SAP extractor.
-
Fine-tune the results in the Data explorer with dynamic filtering for units and metadata values.
-
Specify a data set when you upload files or functions to CDF and filter on data sets on the Files tab in the Data explorer.
Enhancements to features in Beta testing
The features described in this section are currently in beta testing and are subject to change.
- We've released a beta version of the Cognite Industrial canvas where you can access all data, such as documents, engineering diagrams, sensor data, images, and 3D models, on a canvas.
Product release spotlight
Visit the Cognite Hub to watch the product release spotlight video.
Resolved issues
-
In the CDF data modeling framework, we've resolved these issues:
- The Data management page treated fields that started with
=as an expression. - Some users received a 5xx error code when they created or updated data models.
- Some users received a 4xx error code when they loaded the Data management page or retrieved data from the GraphQL explorer.
- The Data management page treated fields that started with
-
For 3D models, we've resolved these issues:
- We've improved the performance when you browse, navigate, and retrieve information in 3D models.
- We've fixed an issue where contextualized assets weren't highlighted if you opened a 3D model from the Data explorer.
-
For data transformations, we've resolved these issues:
- When you selected Profile to view staged data, you couldn't sort functions in columns.
- CDF defined the
split_partSpark function as an undefined function.
-
In the Data explorer, we've resolved these issues:
- If you applied a filter to your data, the remaining filters didn't update.
- Some files were available in data sets but not in the Data explorer.
-
We've fixed an issue where some users received a 4xx error code when they created a group in CDF Access management.
-
We've fixed an issue where some users experienced that files were deleted from their CDF project. We've improved the logs to track the delete history.
-
We've fixed an issue where a
Failure Exception: CogniteDuplicateerror occurred when creating or updating time series.
April 2023
Enhancements
-
We're releasing the advanced CDF data modeling framework into general availability.
Data models are the core of understanding relationships between data objects and establishing data products for data science models, mobile apps, and web apps. You can now express data according to your best practice or industry requirements, such as source system models, solution-specific models, or domain data models.
Version the models to test, iterate, and reuse them to scale with the underlying data. You can model data using the CDF portal application or the CDF CLI and review and explore the data with the built-in query explorer. .
-
We now group 360-degree images from similar locations in 3D views and dim all image indicators behind geometry in point clouds or CAD models.
-
Use the search parameter option next to the search bar to fine-tune your search in the Data explorer.
-
Open selected time series directly in Charts with the Charts preview button in the Data explorer.
-
When you create interactive engineering diagrams, we now recognize bundled tag names, for instance, Tag A/B, as separate tags.
-
You can now use a key/certificate pair to authenticate the CDF extractors to Azure AD.
-
3D models visualize textured surfaces, and the Cognite Reveal 3D SDK now supports textured 3D models.
Enhancements to features in Beta testing
The features described in this section are currently in Beta testing and are subject to change. don't use the features in production systems.
- In Charts, you can define upper or lower threshold values for time series and receive an email if the thresholds are breached.
- The Cognite InRobot beta version has been updated.
Resolved issues
-
In Data transformations we've resolved these issues:
- The transformations preview didn't display data points with negative timestamps.
- Transformations failed due to many
WHENstatements in the SQL query. - Scheduled transformations failing due to service downtimes.
-
In Data search we've resolved these issues:
- A bug in the asset hierarchy request to CDF caused an incorrect asset sub-tree hierarchy.
- Some file types were incorrectly sorted as Other on the Files tab.
- If you uploaded a .zip file to Cognite Functions, the file name extension changed to .txt when you downloaded the file from the Data explorer.
- Deleted files appeared to be available for download from the Files API and the Data explorer.
-
Some users received a 5xx server error response code when they updated large amounts of assets using the CDF Assets API or the Cognite Python SDK.
-
Time series matched with assets displayed as unmatched in the result preview in Entity matching.
-
A blank canvas appeared when you searched on the Data tab in the Data catalog and if you created a new extraction pipeline without the
extractionpipelines:readaccess capability. -
.svg files did not display in Charts.
-
Improved wording in the error message that appears if you sign into a CDF without a project name using the Cognite Java SDK.
-
When you created a CDF project, the access capability
project:listwasn't included in the initial setup of a CDF project and prevented access to the Access management page. -
The processing status on the Revision details section for 3D models incorrectly reported no logs even when logs existed.
See also the Cognite SDKs and CDF API changelogs.
February 2023
Enhancements
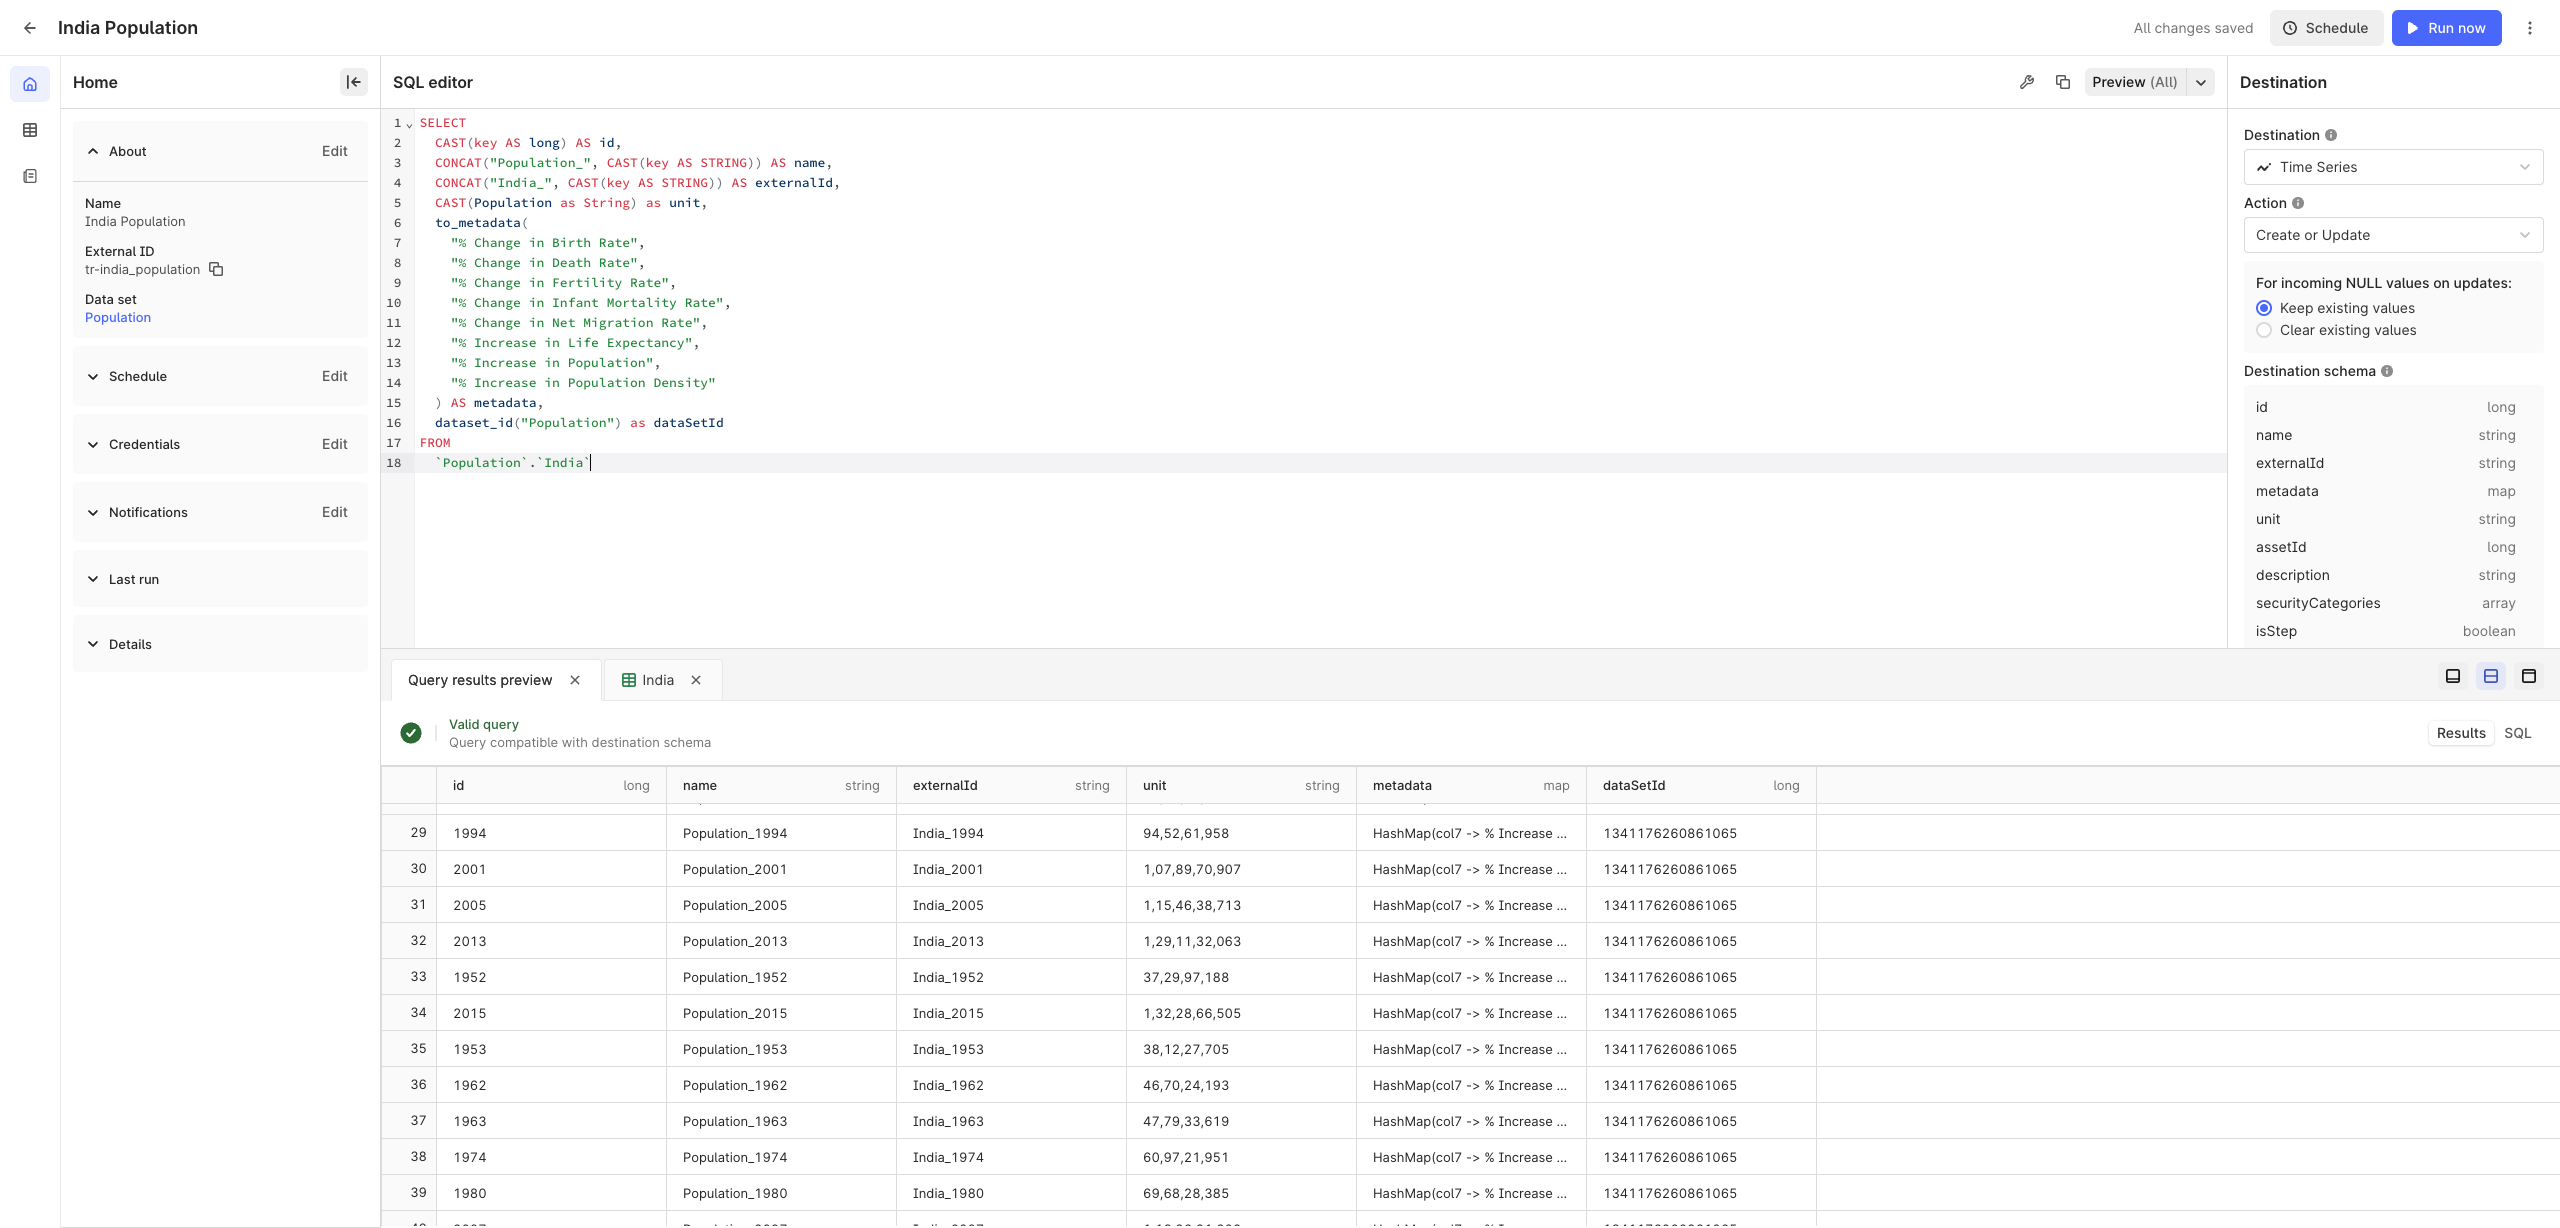
- Transform data with a new interface in CDF Transformations.
- You'll find a new no-code mapping option for source-to-target fields. Map the fields manually or use CDF's suggestions.
- The Spark SQL editor offers built-in code completion, built-in Spark SQL functions, and built-in Cognite custom SQL functions.
- Discover gaps and deviations in time series with the new Data profiling side panel in Charts.
- View 360-degree images, either in isolation or in the context of point cloud, CAD, and BIM models in the Data explorer.
- Preview documents such as text files, JSON files, spreadsheets, documents, and slides in the Data explorer.
- Ingest data from files in JSON format to the CDF staging area (RAW).
- The Annotations API is now used as the storage mechanism for annotations in file viewers. Existing annotations have been migrated from the Events API.
- We've released Cognite InField versions 11.0 and 11.1 with improvements to the InField 3D model and checklists.
Enhancements to features in Beta testing
The features described in this section are currently in Beta testing and are subject to change. We recommend that you don't use the features in production systems.
- Enhancements to the new data modeling feature include:
- Transform data into and between data models using the new CDF Transformation user interface.
- Improved architecture for reusing data across data models.
- Advanced data modeling with inheritance and composition.
- Versioning of data models and data model types to enable no re-ingestion of data across versions for common properties.
- Enhancements to the Data explorer include:
- Filter data using multiple values.
- View connected engineering diagrams side-by-side by clicking links in a diagram.
- Extract well data from the Open Group OSDU Data Platform with the new Cognite OSDU extractor. You can extract data using the OSDU generic API and the Wellbore DDMS. The extractor is compatible with Microsoft Energy Data Services.
- Extract documents with the Cognite File Extractor. You can extract files from local file systems, network sharing protocols such as FTP, FTPs, and SFTP, SharePoint Online Document libraries, Google Cloud Storage, and Azure Blob Storage.
- We've released a Beta version of Cognite InRobot. This new application works in sync with a robot to collect and automate data collection and inspection.
You'll find Early adapter programs and discussion groups for these features on the Cognite Hub.
Resolved issues
- Cognite PI extractor error on Windows Server 2012 R2. Note that this extractor requires .Net Framework 4.8 or higher.
- The Data set list in the Quick match option in Match entities didn't list all data sets.
- Charts would not load and displayed the error message Failed to load firebase error. Make sure to open Charts from within CDF.
- Fixed an error where scheduled transformations were deleted due to an error in the token session refresh.
- Resolved issues in the Data explorer include:
- The filter on the File tab was case-sensitive. Now, you can enter filter criteria with all cases.
- If you selected an asset in the list view on the Asset tab, then changed to the asset hierarchy view, the selected asset lost focus.
- Resolved issues in 3D models and Reveal include:
- Large models with metadata weren't completely processed.
- SolidWorks 3D models inside zip files failed to display.
- A Python SDK Protobuf version mismatch caused an error. The SDK has been refactored to support Protobuf versions lower or equal to version 3.16.0 to fix dependency conflicts with Python packages, such as TensorFlow, Streamlit, and Azure Functions.
- Fixed an error where the Cognite Functions user interface didn't show data in the Input data field when you listed scheduled functions.
December 2022
Enhancements
-
Cognite Charts is now an integrated part of the CDF portal under Explore and Build. New functionality includes:
- View CDF events and time series simultaneously on the chart plot.
- Set thresholds to check if time series cross a specified value.
- See calculation status messages in the user interface.
- Get better results if you're searching for documents with Japanese content.
- Time series descriptions automatically update if you change the description in the
Descriptionparameter for the time series in the CDF API.
-
Use the new search and view options in the Data explorer to:
- Search across all data types and add filters for metadata.
- Search for content inside documents.
- Customize and sort columns for the displayed results.
- Inspect equipment surroundings and find nearby equipment by looking up the location of assets in contextualized 3D models. Use the 3D availability column on the asset panel in the asset search results view, or navigate to relevant 3D models from the asset details panel.
- Add multiple 3D models to the same 3D view to combine and compare models. You can add CAD models and point clouds/laser scans.
- Measure distances and slice 3D models to focus on specific parts using the new menu options in the 3D view.
-
We're introducing a Data Catalog, a collection of data sets that serves as a central and secure library of data assets you can search, explore, and manage in CDF. Use the Data Catalog to get an overview of the data that's available to you. You can also use it:
- As part of your onboarding workflows: to get overviews of existing data and to verify that newly onboarded data appears as expected.
- As an entry point to searching and exploring data sets and data resources.
- As a way to manage data governance and user access to data resources.
-
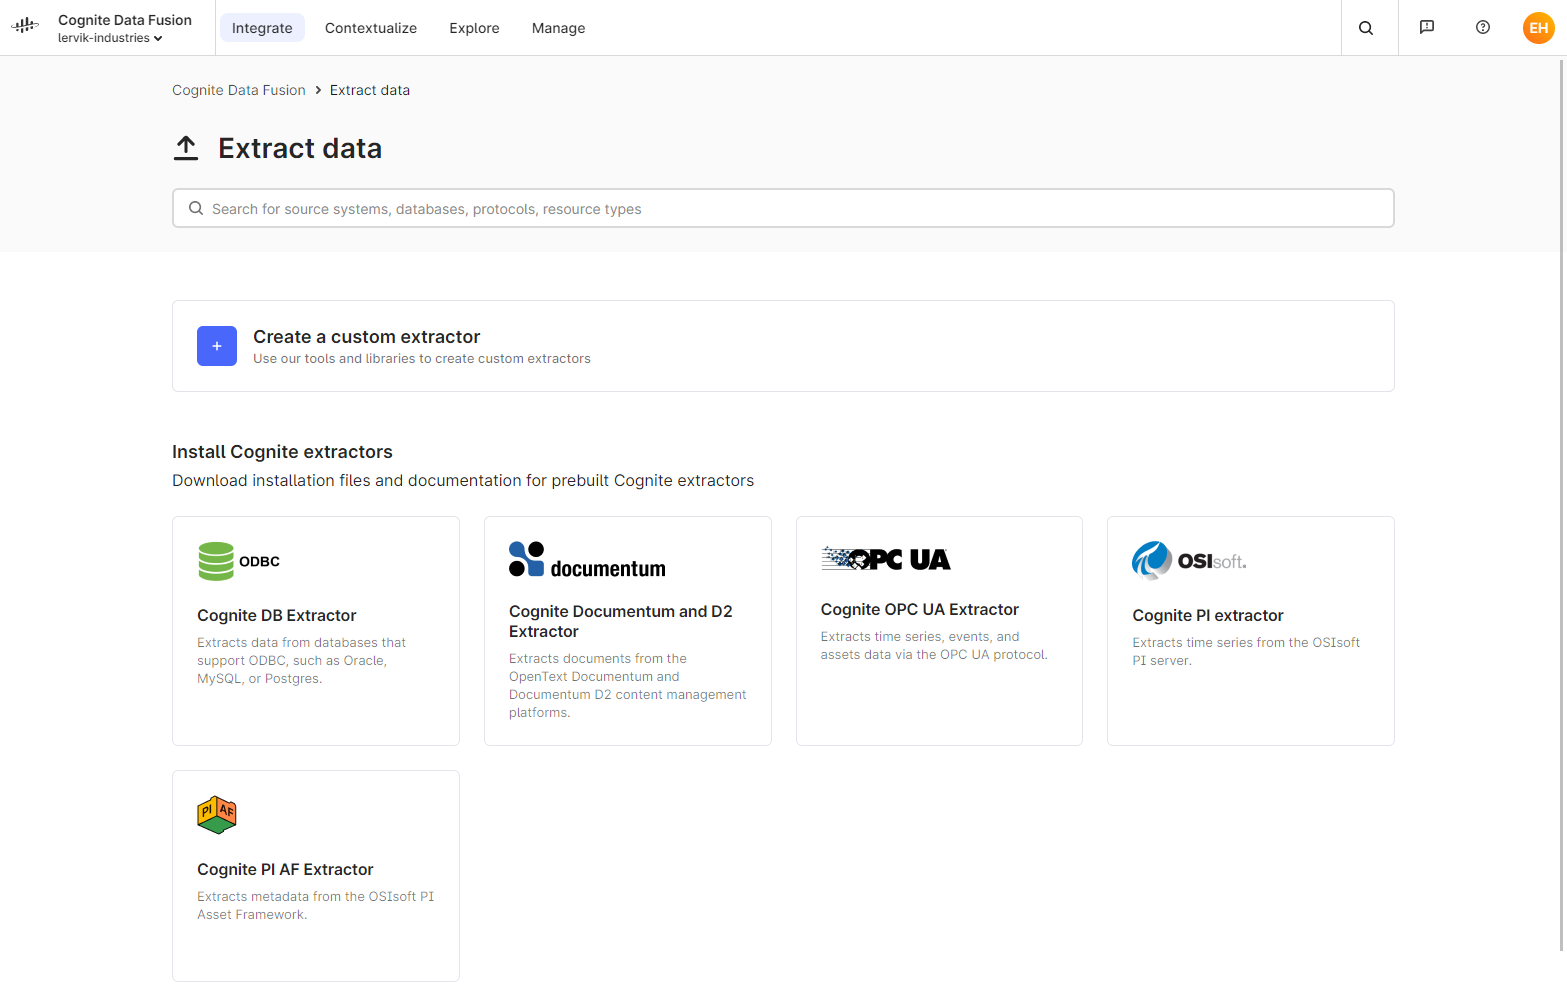
On the Extract data, you'll find source system logos and the best-fitted data extraction tool for ingesting data into CDF. On this page, you'll also find new Cognite extractors you can use to extract well data from source systems. In the data extraction documentation section, you'll find articles on how to set up and run the general CDF extractors and the specific CDF extractors for well data.
-
Integrate and view 360 degree images in Cognite Reveal.
-
The 3D service can now process Navisworks (NWD) model files. See Supported 3D file formats.
-
We've added paginating to the Retrieve data points endpoint. You'll receive a
nextCursorfor time series with multiple data points. The first data point on the second page follows immediately after the last data point on the first page. We've also improved performance for retrieving data points for time series using the Cognite Python SDK v5.
October 2022
Images contain essential information required for optimizing operations. This release of Cognite Data Fusion (CDF) introduces image and video management, where you can upload, organize, and explore the image and video data and add annotations to the images. With the new image contextualization API, you can detect assets tags, text and people using industry-relevant detection models.
We've also made it easier to work with the data flow from a source system into CDF with the option to create, edit, and troubleshoot the extractors' configuration files in the CDF user interface.
Read more about this and other improvements below.
Image and video management
Images contain information such as the time or location of a photo, a number on a tag, or rust on a pipe. Use the new Image and video management tool to upload and enrich images and videos to CDF. Then, organize and explore your images and videos in a list view, gallery view, or on a map and add or review annotations to the images. Read more
Using the Vision API and the Python and JavaScript SDKs, you can find data based on visual content and link images to assets by analyzing the images with detection models, such as asset tag detection, text detection, and person detection. The person detection model protects privacy and complies with GDPR.
Create and edit extractor configuration files in the CDF user interface
The Cognite extractors connect to source systems and push data to CDF. When you set up or want to change the extractors, you can now create and edit the configuration files to fit your requirements on the Extraction pipeline page. This will reduce the time and effort spent accessing the configuration file on the extractor's host machine and make it easier to iterate and deploy the configurations settings and investigate extractor run issues.
When you're ready to apply the configuration to a production environment, we recommend setting up remote configuration files stored in the cloud using versioned files and continuous integration systems, such as GitHub Actions, or directly with the CDF API. Read more.
Point cloud visualization in 3D models
With improved point cloud visualization in the 3D digital twin models, you'll find the rendering of objects clearer, more uniformed and with higher fidelity. This will make it easier to distinguish which object is in front and which is in the back when looking at digital twins.
Place measurements in 3D models
Use the Cognite Reveal SDK to measure simple point to point distances in 3D models by clicking to- and from-points. For example to fit a new piece of equipment in a designated location. The default measurement unit is meters, but the tool provides callbacks to allow configuring the unit.
Historic time series
The CDF time series service now allows data points starting on 01.01.1900T00:00:00Z (1 January 1900), specified as milliseconds since the epoch. This means you can import a more complete time series history to CDF. Time should be specified as a negative integer value for data points prior to midnight on Jan 01, 1970, and as positive integer values for data points after.
August 2022
Cognite Data Fusion (CDF) makes data do more. This release focuses on rapid, reusable, and scalable industrial data science by introducing new code and non-code solutions. With Cognite Functions, you can deploy and host Python code for additional calculations and models using the data in CDF. Cognite Charts offers a guided user interface to perform industrial data analytics, troubleshooting, and root cause analysis.
Read more about this, how we've polished up the CDF user interface, and other improvements below.
Cognite Charts
Cognite Charts is a graphical user interface that lets domain experts explore data and trends and perform troubleshooting and root cause analysis. No programming skills are required to use Cognite Charts. Read more.
Cognite Functions
Cognite Functions offers Python functions as a service, reducing the effort and expertise needed to deploy solutions using CDF data. Model data in your programming language and according to your company or industry standards, then call the code on demand or schedule regular runs. Read more.
You can deploy Cognite Functions using the Cognite API, the Cognite Python SDK, and the CDF user interface.
Improved Transform data page
CDF Transformations has a new user interface to guide you through the process of transforming data from the CDF staging area to the CDF data model. The new interface is fully backward compatible with existing transformations. Read more.
Improved Extract data page
The improved Extract data page makes it easy to find your best fit extractor and the installation files. You'll also find links to the Cognite Python and .NET utils packages and SDKs to get started creating a custom extractor. Read more.
Improved Explore data page
- Files are grouped by their document type on the Files tab.
- The search bar is moved to the top of the page and displays the search results count on resource types.
- You can reset your filters, and a red badge indicates that filters are applied. You can also collapse the More filters section.
- We've improved the navigation when you search for a tag in an engineering diagram, such as a P&ID.
New Annotations API
CDF can detect references to tags and assets in engineering diagrams, documents, and images. The detections are often called annotations. The new Annotations API introduces strict schema validation to avoid invalid annotations and a well-defined flow for suggesting, accepting, and rejecting annotations. The API also enables third-party applications to enrich documents in CDF with custom annotations. Read more.
Ensure geospatial data integrity using data sets
The geospatial endpoint is the entry point for resource types enabling storing and querying item collections with a geospatial nature. You can now use data sets to document and track data lineage for the geospatial features and feature types. Read more.
3D models
You can now upload 3D models in IFC open file format to enable CDF to process and host Building Information Models (BIM).
June, 2022
This June release has several improvements for the end-user and the developer.
View more details in complex CAD models
To see more details and better understand the facility, we've improved the visual quality when you view large and complex 3D models.
Also, we have improved the 3D processing pipeline and the load performance so that you can load geometry while the camera is moving. Note! To take full advantage of the improvements, you need to re-upload any 3D models processed before March 2022.
A better user experience signing in to CDF
Signing in to the CDF user interface can be cumbersome if you don't know the authentication setup in your organization. With the new CDF sign-in flow, you only need to enter your organization's domain name and specify which CDF project you are signing in to. Your organization domain name is usually your company name spelled without spaces or an abbreviation of the name.
Add your customer logo to the sign-in dialogs for a more personalized experience.
Authenticate your CDF solutions
To allow the developer to focus on solution development instead of setting up authentication infrastructure, it's now possible to authenticate for solutions built on top of CDF without writing multiple lines of code. The @cognite/auth-wrapper is an OpenID Connect/OAuth 2.0 wrapper library written in JavaScript. It helps you retrieve an access token from any IdP that meets the OpenID standard, making it easy to sign in with our JavaScript SDK. Features in the authentication wrapper SDK include:
- NPM supported auth package
- Support for multiple auth flows
- Detailed documentation on how to use the package
- Detailed documentation on how to navigate key IdPs (i.e., Azure AD)
Search, filter, and sort data in the CDF Data explorer
We've polished up the CDF Data explorer to make it easier to find the data you are looking for:
- You can reuse any Search and Filters you have defined. Simply copy the URL and share it with your co-workers.
- The search criteria you enter in the Search bar are now kept when you toggle between the different tabs in the explorer.
- On the Files > File details tab, you can scroll up and down the list of metadata to find what you're looking for.
- We've added a notification to let you know that you cannot upload files greater than 5GB.
- You can now sort in the metadata tables.
- We've fixed reported bugs and general styling issues.
Increased number of columns for sequences
Sequences now support up to 400 numeric columns (up from 200) and 200 string columns. Read more.
DirectQuery support for Power BI (Early adopter)
DirectQuery is a feature in Power BI that enables you to fetch data on demand and build Power BI dashboards with hundreds of time series and thousands of data points. With DirectQuery, no data is imported or copied into Power BI Desktop. Instead, Power BI queries CDF for the data every time you interact with the dashboard.
Cognite Data Source for Grafana
The Cognite Data Source for Grafana now supports the CDF relationships resource type. You can fetch time series based on relationships in the Time series from asset tab and filter the relationships on data set, labels, and active relationships based on the time filter selected in Grafana. The new Relationships tab allows you to use Grafana's Node Graph visualization plugin or the new (alpha) custom visualization plugin available at cognite-grafana-relationships-visualization.
Templates support (Early adopter)
We've added a new Templates tab to support the CDF Templates feature. Using templates with Grafana allows you to scale your dashboards dynamically when you add equipment. You can enable this feature in the data source settings.
Read more about Templates and Early adopter.
April, 2022
Data governance is key to ensuring high quality throughout your data's lifecycle, and Cognite Data Fusion (CDF) has the tools and features to secure that the data meet your expectations. This release optimizes data management by introducing more granular access to data transformations using data sets.
Read more about this and the other improvements for the CDF April 2022 release below.
Scope transformation access to data sets
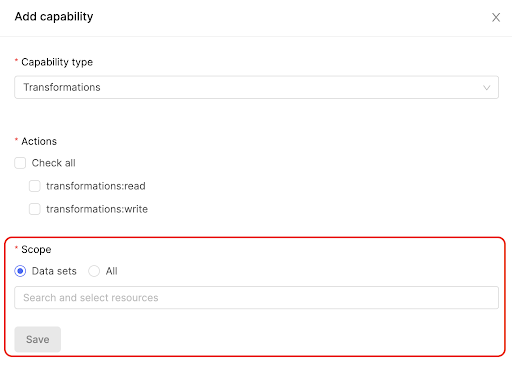
Protect access to CDF SQL transformations from ungoverned actions and visibility by associating a transformation to a data set. Users will only be able to see and run the transformations associated with the data sets they have access to.
-
As a project admin granting users access to transformations, select the data sets a user can see and run transformations for under Scope in the Transformations capability dialog:
-
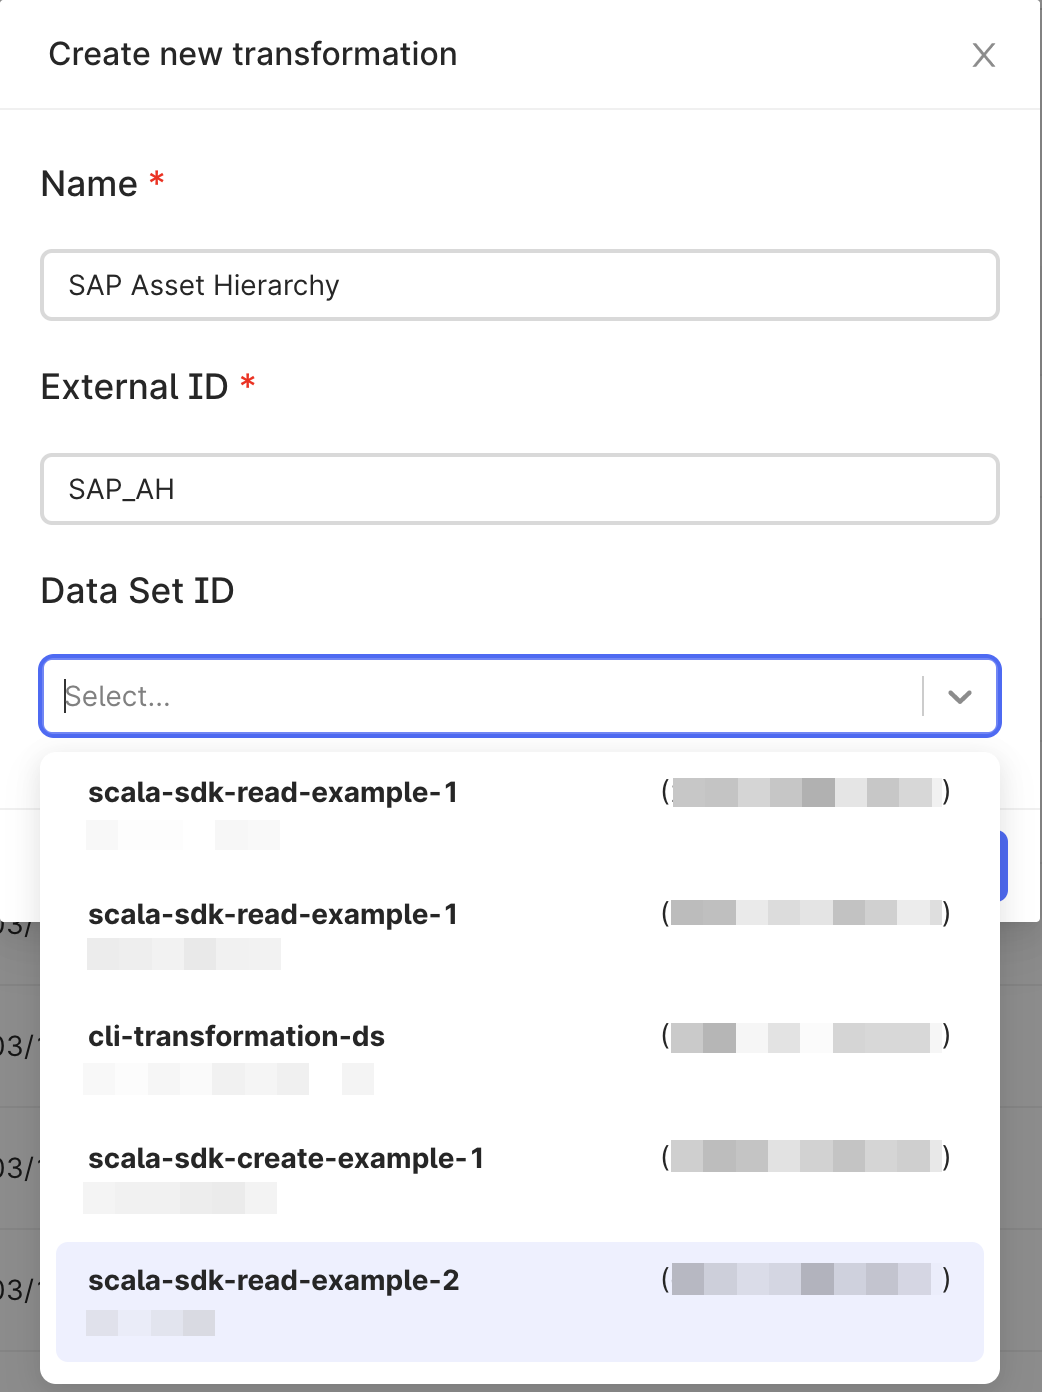
As a user creating a transformation, select the data set you want to associate to a transformation in the Create new transformation dialog. Only users with transformation access to this data set can see and run the transformation.
This feature is also available in the CDF API, Python SDK, and Transformations CLI. Read more about transformations.
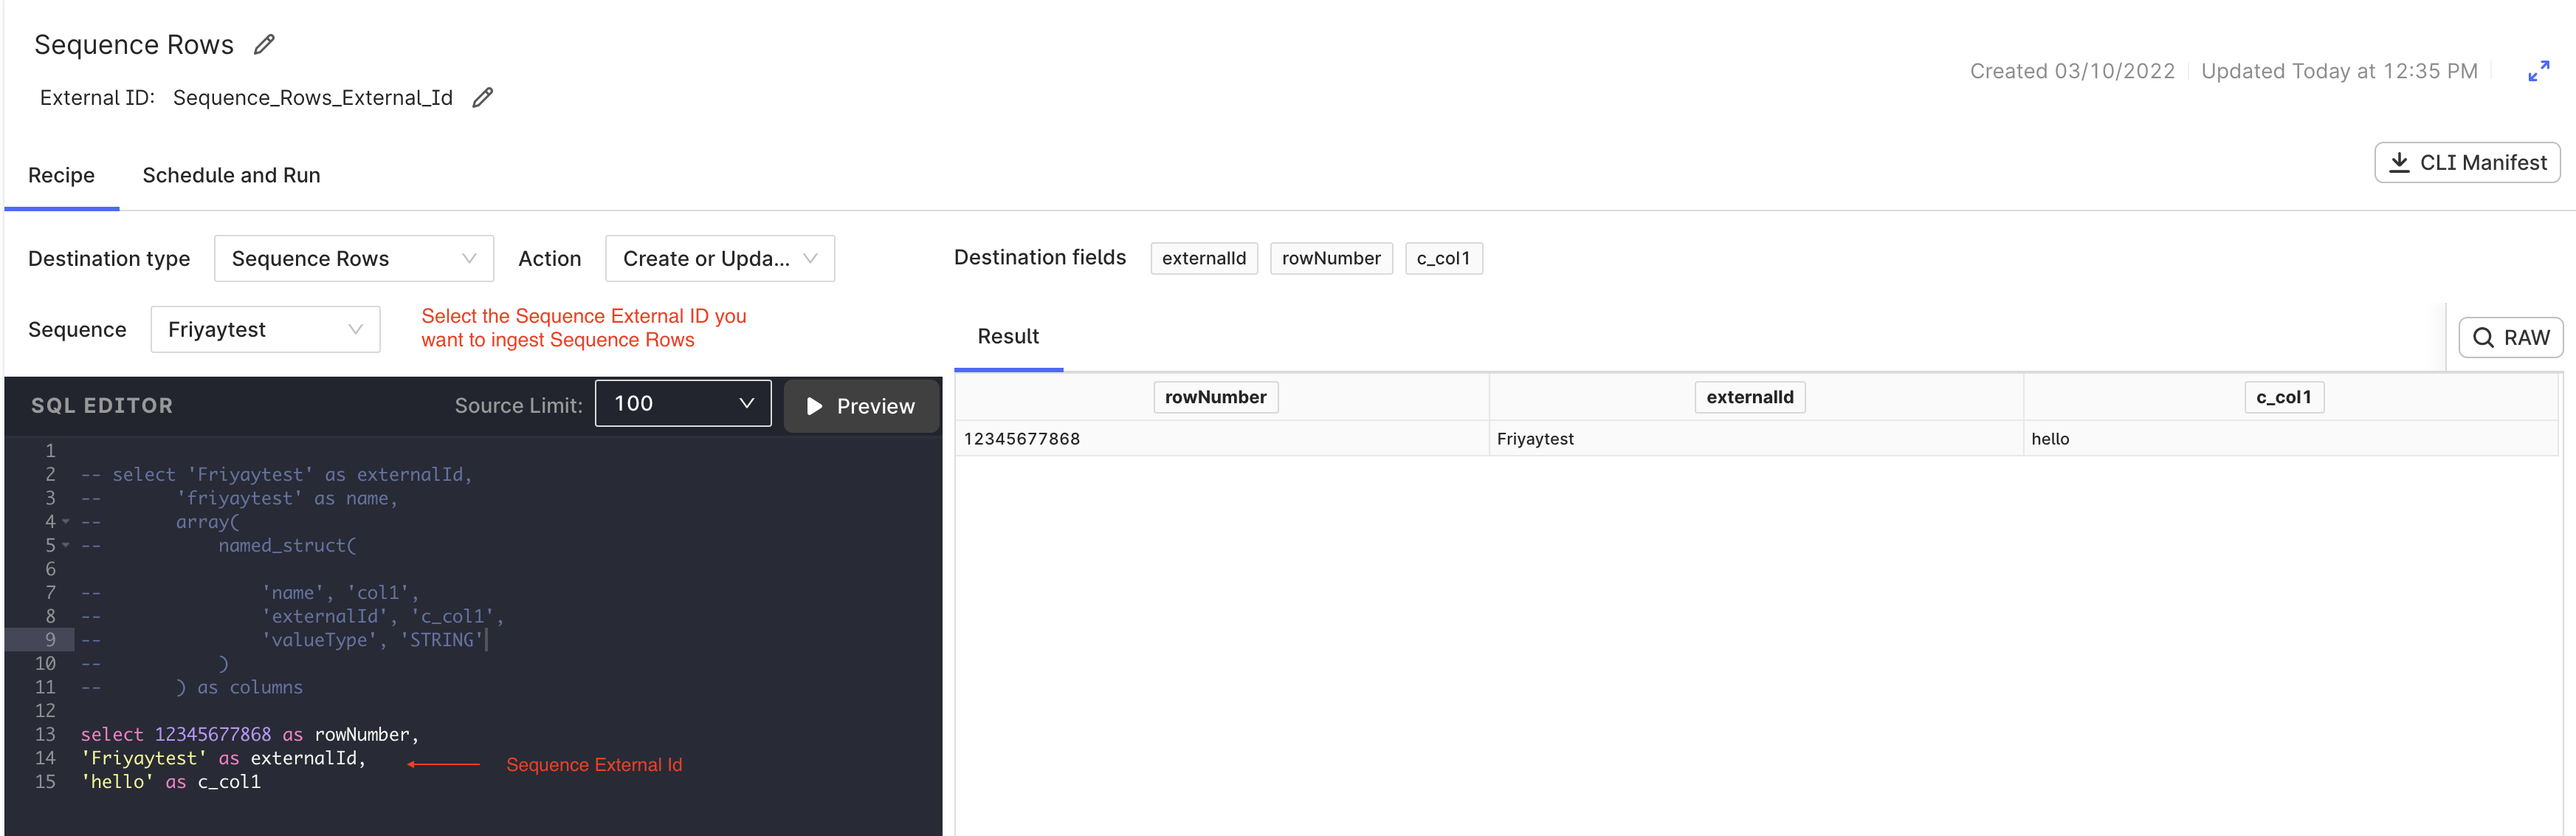
Ingest data into sequence rows
You’ll now find Sequence Rows as an option in the Destination type field on the Transformations page in the CDF user interface and no longer need to use other developer tools like APIs and SDKs to ingest sequence rows into the Sequence resource type in CDF.
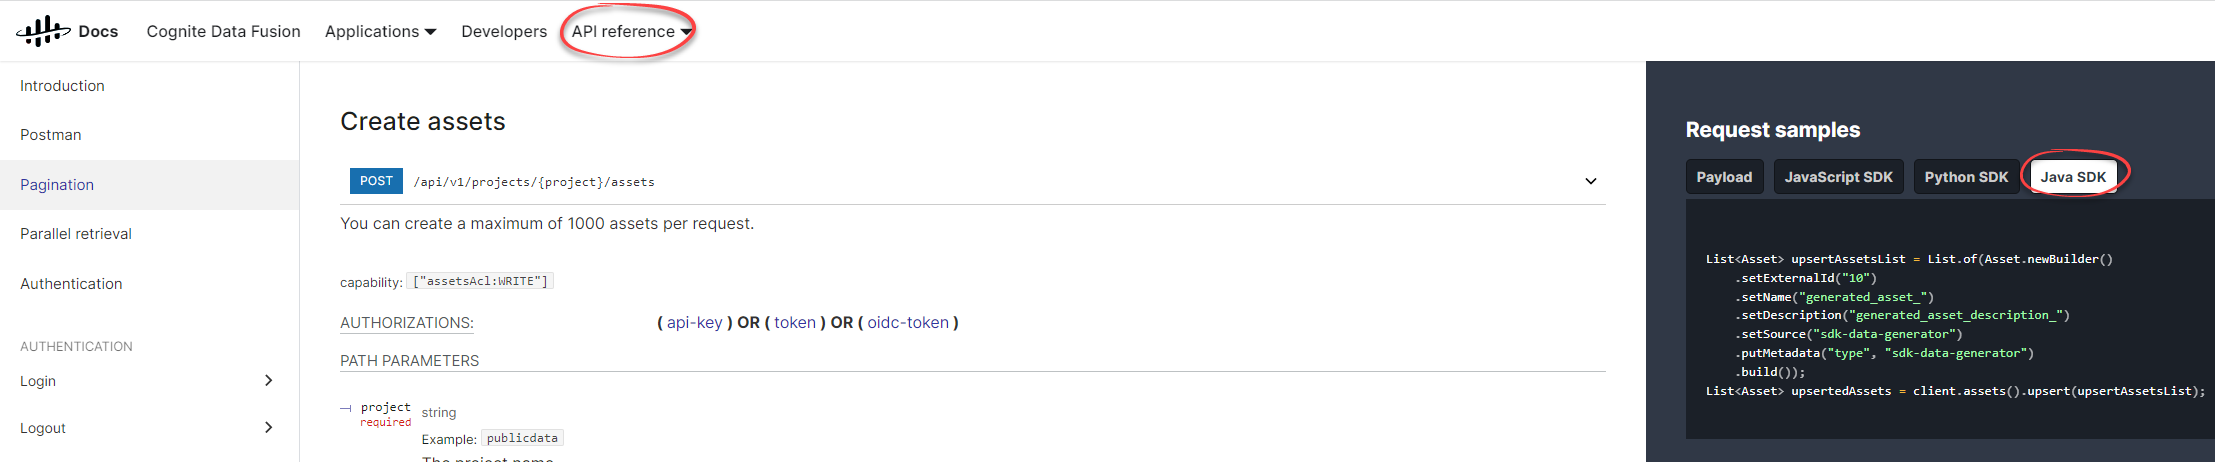
Develop applications using Java
Already, you can build solutions using Cognite's SDKs. Now, we introduce the Cognite Java SDK to interact with the CDF v1 APIs. The Java SDK is optimized for data publishing and allows you to write data efficiently with the upsert function. The Java SDK covers core CDF functionality, such as contextualization and data extraction. You’ll find all the info you need in the cdf-sdk-java repo, and we have updated the Cognite API documentation with code samples on how to perform tasks with the Java SDK.
Change isStep setting for ingesting time series to CDF
When you stream time series data points into the CDF data model, the interpolation between the data points is controlled by the isStep property on the time series object. You can now change the isStep property value without recreating and re-ingesting the entire time series.
February, 2022
Cognite Data Fusion (CDF) streams data into the CDF data model, where the data is normalized and enriched by adding connections between data resources of different types to provide better business decisions. With this release, you can ingest geospatial data into CDF to contextualize and map with other CDF resource types to deliver accurate spatial analysis and statistics.
Read more on this and all the other improvements for the CDF February 2022 release below.
Geospatial data
Work with geospatial data using the Geospatial API and Python & JavaScript SDKs to handle the positioning and geometry of CDF data. We currently support a multitude of coordinate reference systems (CRS), but you can add other entries from the European Petroleum Survey Group (EPSG) as a custom CRS. You can also transform an input CRS to the defined CRS to improve the search in geometrics. Read more.
Ingest PI Asset Framework data to CDF
The new Cognite PI Asset Framework (AF) extractor is considered an extension to the Cognite PI extractor. The Cognite PI AF extractor retrieves a dump of the asset hierarchy from the Asset Framework on the PI Server and ingests this into Cognite RAW. Subsequently, the extractor regularly checks for updates in the PI asset framework and ingests any changes into CDF.
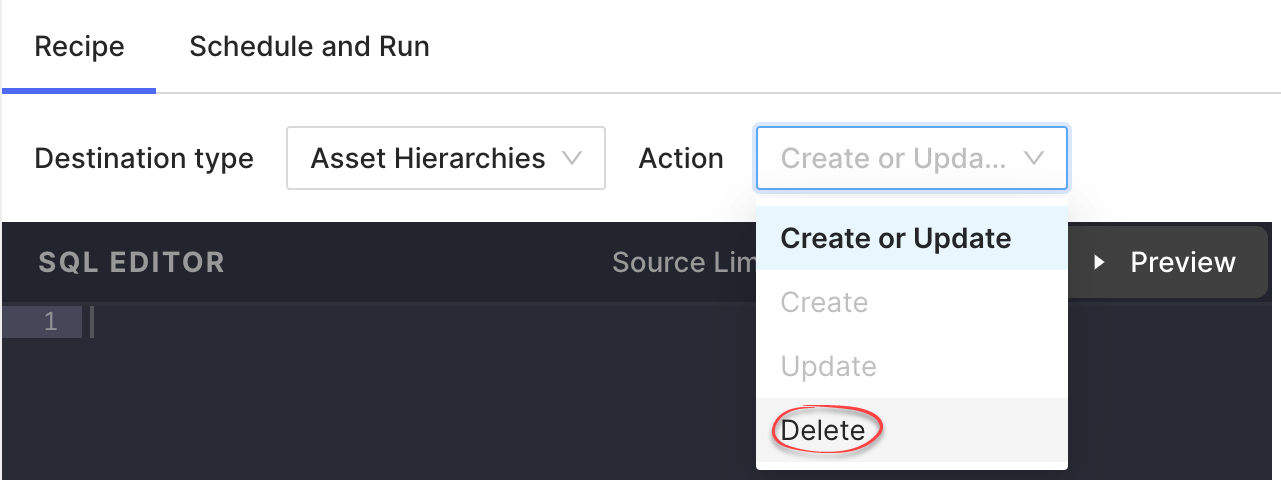
Delete asset hierarchies using CDF Transformations
You can now delete asset hierarchies in CDF using CDF Transformations. Items are deleted by their internal ID, and non-existing IDs are ignored. Read more about CDF Transformations.
Ingest data into CDF Relationships using PostgreSQL gateway
We're rolling out the option to use the PostgreSQL gateway and Azure Data Factory (ADF) to ingest data directly into CDF Relationships. Select the public.relationships table in your ADF sink. Learn how here.
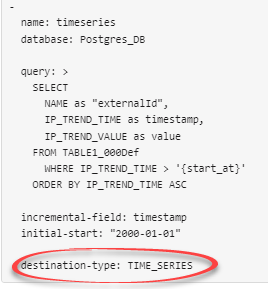
Ingest time series data points directly into CDF Data points using the Cognite DB extractor
The Cognite DB extractor, version 2.4.1, provides a new option to ingest data points directly into CDF Data points instead of Cognite RAW. Set destination type as TIME_SERIES in your configuration file.
Early adopter programs
Cognite offers several Early adopter programs to our users. We encourage you to take this opportunity to learn about and test our features currently in the making. Navigate to Cognite Hub, open the Group tab, and select Request to join to become an Early adopter candidate.
December, 2021
Trusting the data in Cognite Data Fusion (CDF) is the core of managing, building, and using the Cognite product suite. Data engineers need sufficient insight into the staged data to take the next step on the ingestion journey and the new data profiling report on staged data in Cognite RAW caters for this.
This CDF release also introduces the new Cognite Solutions Portal. The Cognite Solutions Portal collects applications, use cases, and other helpful links to solutions your organization has built on top of CDF. Users no longer have to keep track of many different URLs to access the information they need in their daily work.
Read more about this and all the other improvements for the CDF December release below.
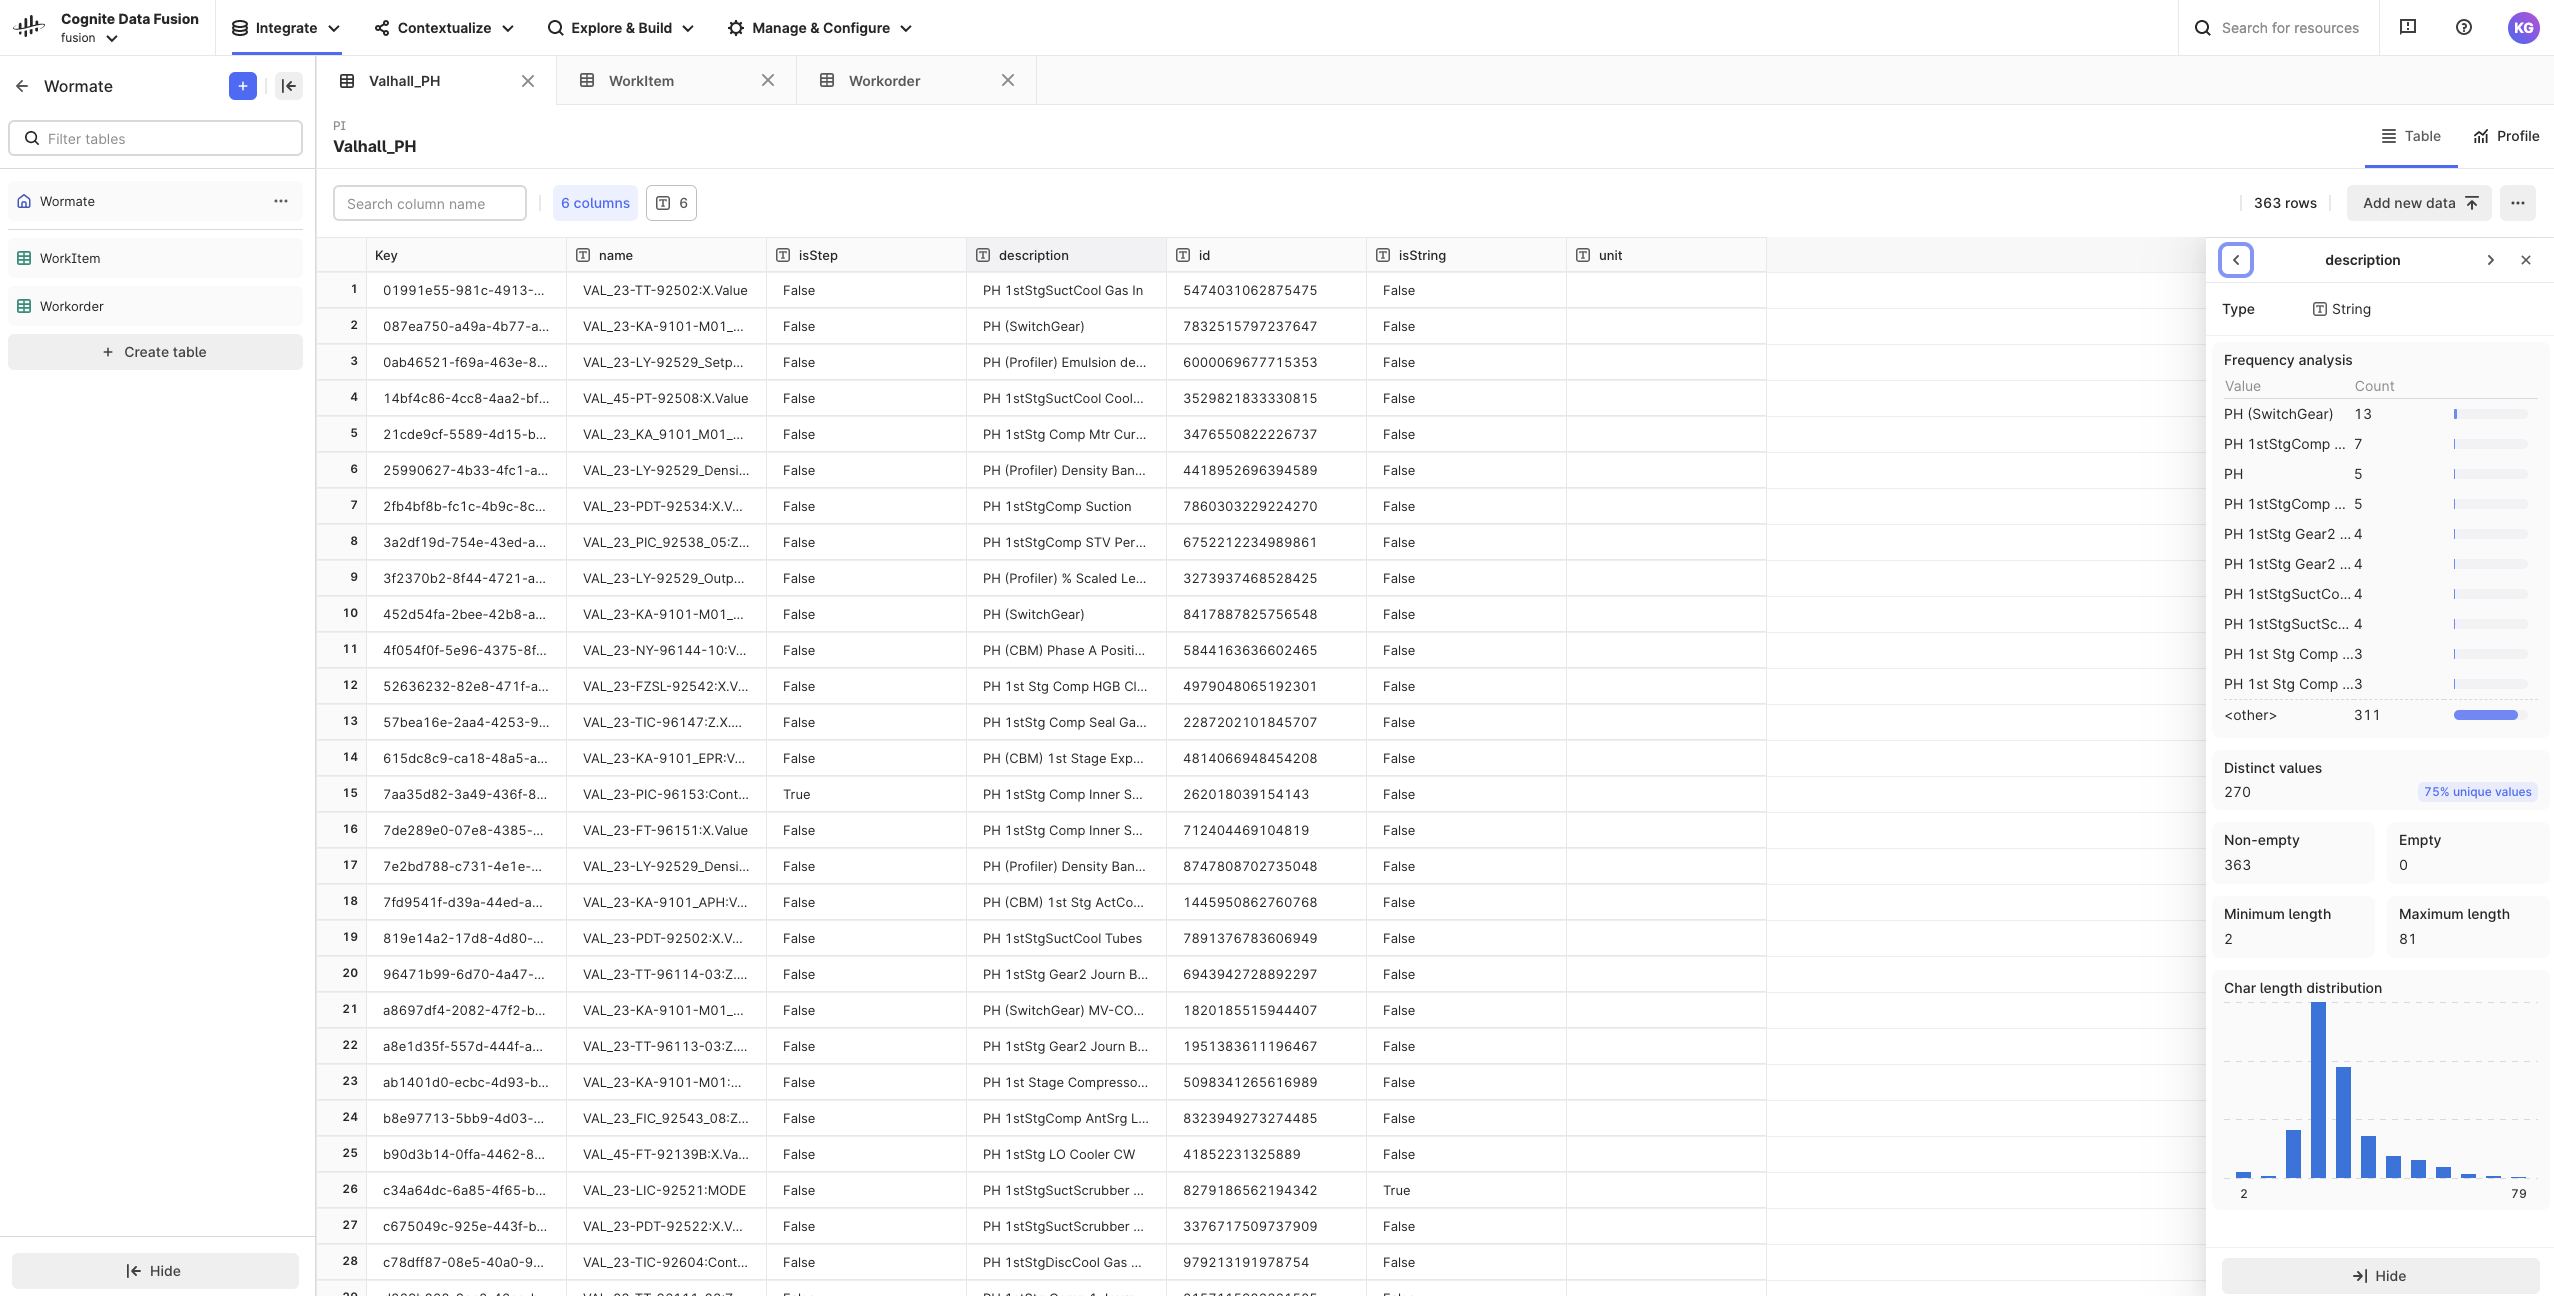
Data profiling on staged data
To get in-depth knowledge about the data quality, discover patterns, outliers, and see other statistics in the new standard profiling report available on the Profile tab in Cognite RAW. Report your findings to the data owners and use this as a trigger to discuss topics such as the best fit for the primary key column and contextualization and to provide the best support for the end-users of the data. Keep iterating on the data integrations to improve the data quality and prepare the data transformation into the CDF data model. Read more here.
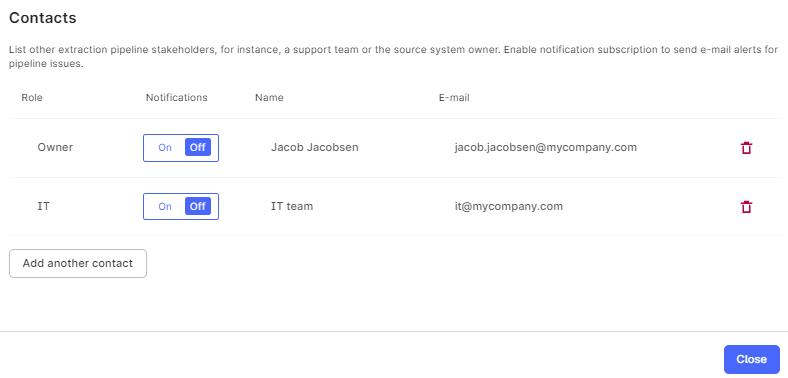
Get notified about interrupted data flow into CDF��
Catch any issues that interrupt the data flow into CDF by setting up email notifications on the Extraction pipeline page. You can define the time condition for triggering the email. Learn how to set it up in this article.
New Transformations CLI
The new Transformations CLI replaces the old Jetfire CLI offering a better developer experience. Now, you can easily declare and manage variables in the configuration file without any hard-code. You install the CLI using the Python pip package manager.
Read more here.
APIs and Python SDK for Transformations
The Transformations APIs and Python SDK are promoted to Version 1. Using the APIs/SDK, data engineers can orchestrate transformations sequentially, making it more reliable and quick. Check out the API docs and SDK docs for more information.
Access management for SQL Transformations
You can now manage access to SQL Transformations using the new transformations:read and transformations:write capabilities in your CDF group.
We still support transformation access using the transformations or jetfire groups for existing users to ensure backward compatibility. However, we recommend that you switch to managing access to Transformations using the new capabilities.
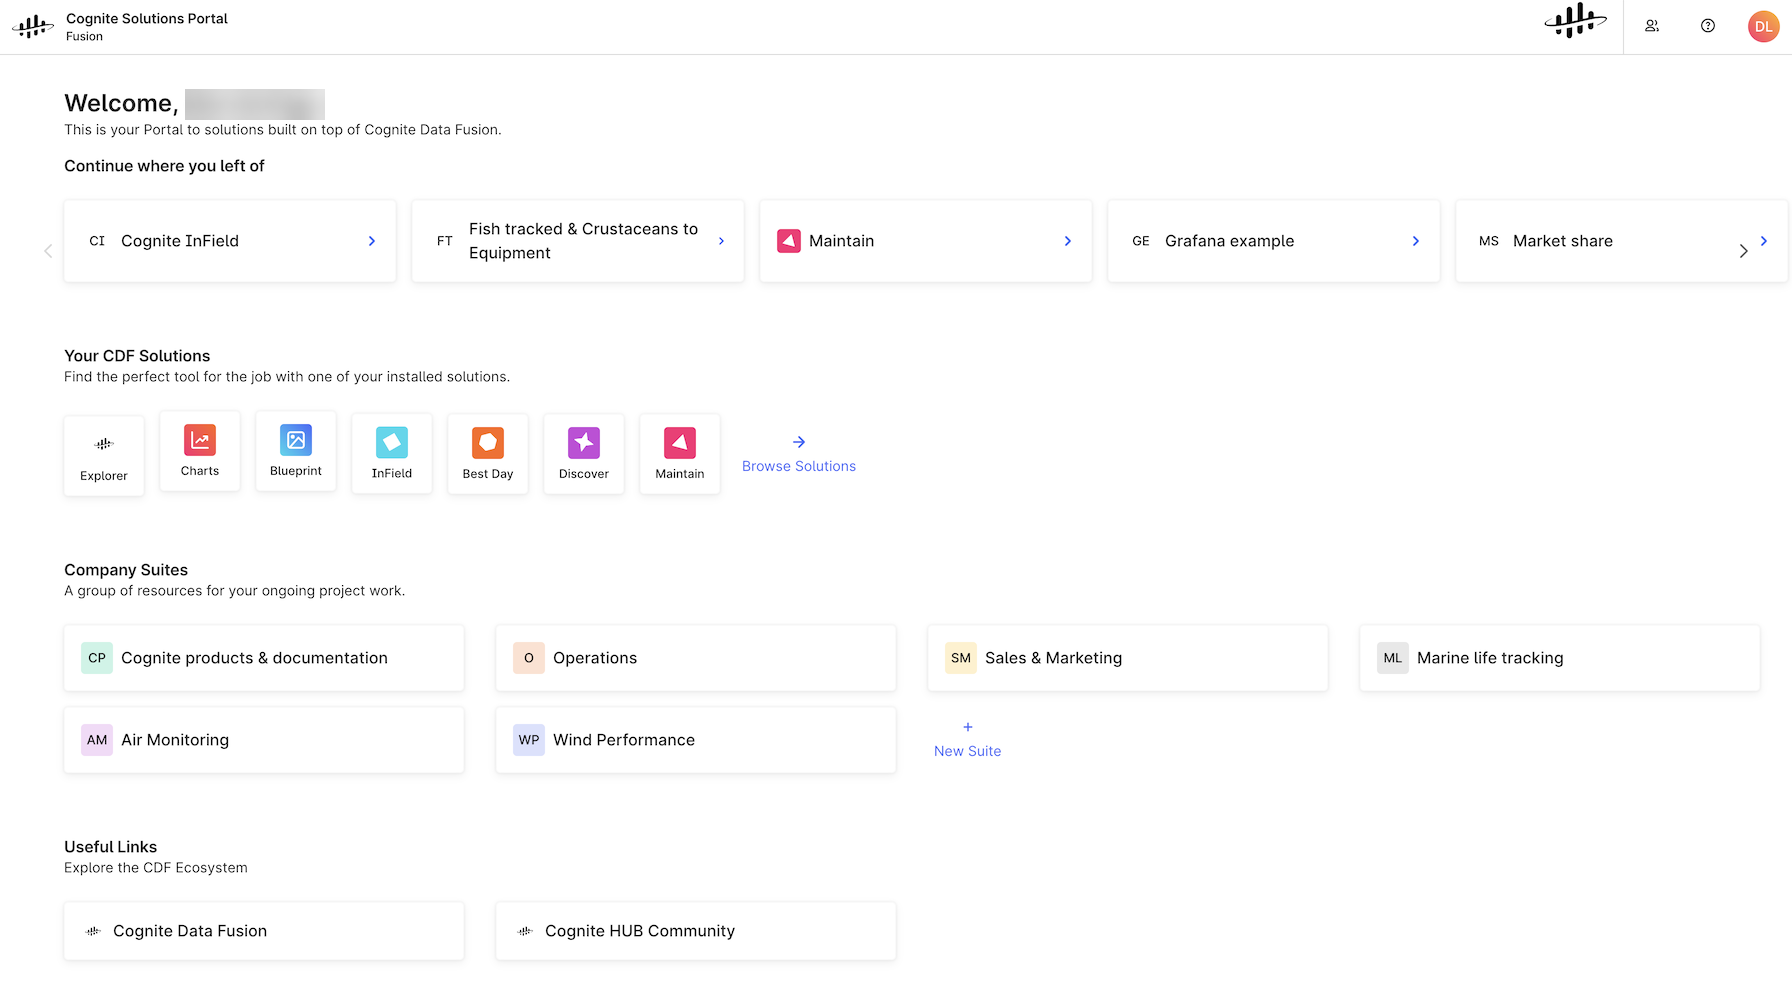
Introducing the Cognite Solutions Portal
As companies ramp up their digitalization and transformation efforts, the number of applications, dashboards, and use cases increases rapidly. As a result, end-users have to keep track of many different URLs to access the information they need. This is the problem Cognite Solutions Portal sets out to solve. It gathers all your CDF-enabled solutions in one place.
Use the Cognite Solutions Portal to add applications, dashboards from analytics and visualization tools, and helpful links into shared spaces.
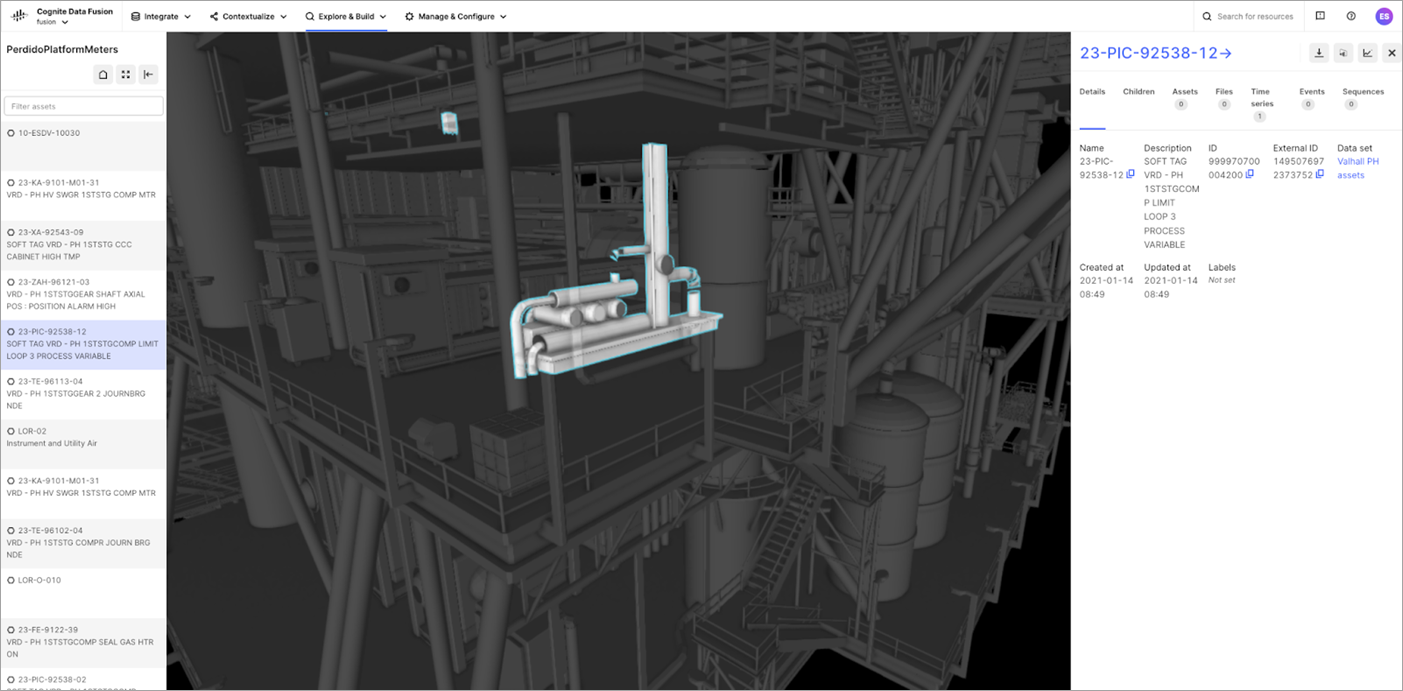
Explore data in 3D
The CDF Data explorer already helps solution builders and data scientists find, validate, and learn about the data in CDF. Get the full experience by navigating and searching for assets and viewing the details in 3D models on the new 3D tab in the CDF Data explorer.
Cognite Charts
Cognite Charts runs on top of CDF and is a powerful tool for engineers and domain experts to explore, trend, and analyze industrial data. For more information, visit the Charts Early Adopter Group on the Cognite Hub.
This release has the following improvements:
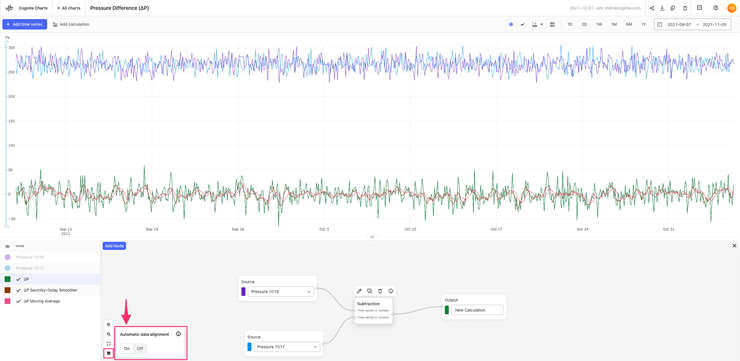
Automatic data alignment
Charts now automatically handle data alignment in your calculations. Time series data often have different sampling frequencies and time stamps, and it can be hard to do even the simplest calculations (e.g. timeseries_1 + timeseries_2), especially if you’re not proficient in Python. Calculation results will be inaccurate and untrustworthy without properly accounting for data alignment.
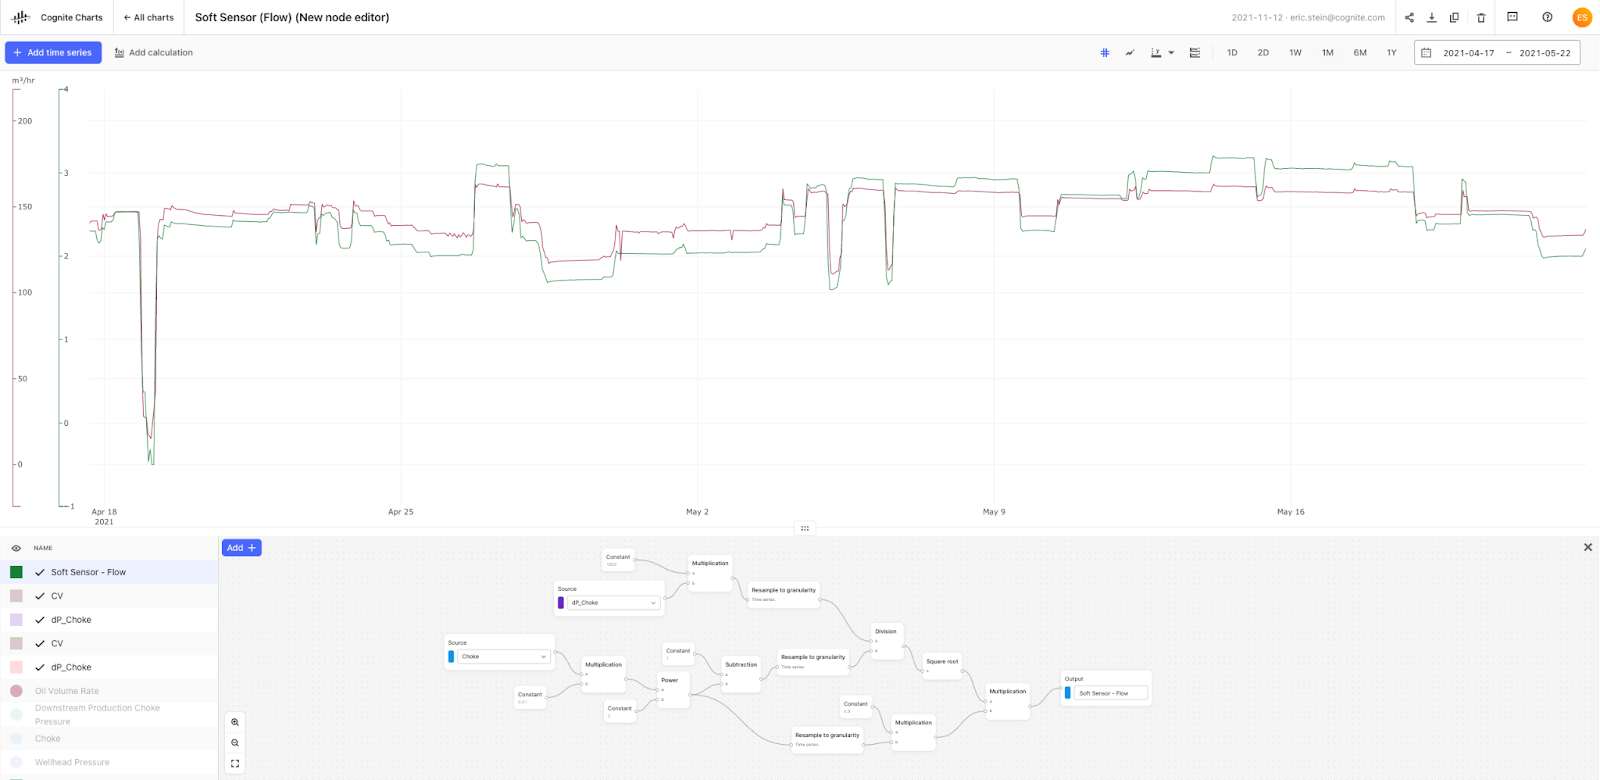
A new and improved no-code calculation builder experience
The no-code calculation builder has been redesigned and rebuilt on a new, powerful library.
October 2021
This release of Cognite Data Fusion (CDF) contains enhancements to all capabilities for ingesting, managing & building trustworthy industrial data products to be used for data-driven decisions.
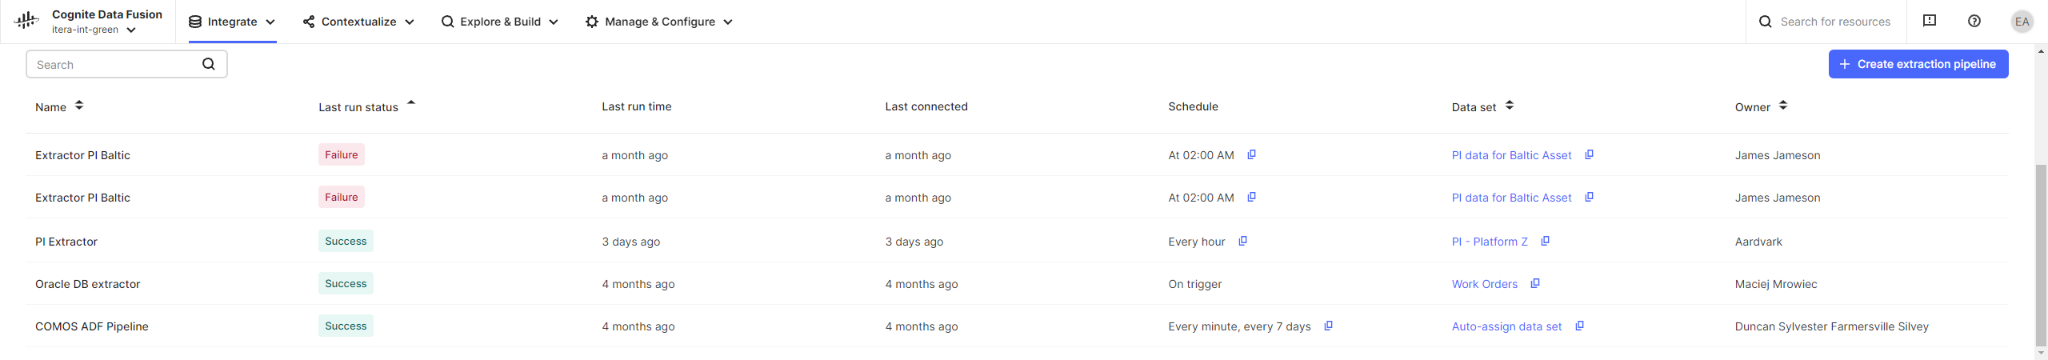
Data engineers need observability to inspect, monitor, and debug solutions in production. Therefore, we’re introducing Extraction pipelines where you can monitor the status of data ingestions to make sure reliable and trustworthy data are flowing into the CDF data sets. When you set up extraction pipelines, you can add comprehensive documentation and email alerts. You’ll be instantly notified, can quickly start troubleshooting, and have on-the-spot contact info to data set owners and other stakeholders if ingestion issues occur. You create and view these pipelines either from the Data set lineage page while you are already working with a particular data set, or you can get a bird’s eye view across several data sets via the Monitor extraction pipeline page. Read more.
If you’re using the PostgreSQL gateway, you can add status reporting to your Azure Data Factory pipeline. If you prefer working more programmatically, the new version of the Python Extractor Utils allows building extractors with status reporting, or you can use the REST API or Python SDK. The Cognite Extractors support status reporting from our next release.
Running SQL transformations using APIs and the Python SDK significantly improves the developer experience as data engineers can manage transformations programmatically. Using the APIs/SDK, data engineers can orchestrate transformations sequentially, making it more reliable and quick. Check out the API docs and SDK docs for more information. Note that the Transformations APIs and Python SDK are in public preview and will be promoted to V1 (production use) in November 2021.
Data discovery by contextualizing engineering diagrams, typically P&IDs, has already shown its value in the market. In this release, we’ve redesigned and enhanced the Create interactive engineering diagrams process to give a delightful user experience. The new sidebar navigation guides you carefully through each step in finding, extracting, and matching tags and linking these to the asset hierarchy and other associated resource groups. New actions that improve the quality of the diagrams include approving and rejecting automatically detected tags, clearing all tags on a diagram, and better name-mapping and use of synonyms in tag detection. When you’re done creating interactive diagrams, you can convert the approved PDF files to SVG if this is your preferred format. Read the How-to guides.
The solution builders and data scientists need transparent and easily accessible documentation and information about data science scripts and models to make correct and informed operational decisions. You’ll find it all in the Cognite Industrial Data Science Library.
Industrial data analytics must be of high quality and Cognite Charts is focused on the nitty-gritty details and to give you a smooth charting experience. You’ll find function descriptions by clicking the Information icon located next to a function. Notice also that named inputs/outputs in Cognite Charts make it clear to see which are required for a function. When you zoom in to a specific point on a time series, the aggregated values automatically switch to showing the raw data. In addition, all measurement units stored on time series in CDF are now displayed in Cognite Charts.
For the solution builders, we’ve enabled client credentials grant flow in Grafana. In some cases, for example, if you're using the Grafana free tier, you can not set up an identity provider for the whole Grafana instance. Instead, you need to set up a client credentials grant flow for each instance of the Cognite Data Source. You’ll find all the information you need to set this up in this article.
For the CDF administrators, we’re introducing a new token session service for managing internal sessions and exposing internal and external endpoints for interacting with them. The token session API service allows users and service principals outside the API to run jobs within the API. External principals can use the sessions API to delegate their access to functionality in CDF. You can use this functionality to set up and manage long-lived or timed access for internal services. The access is rooted in the respective principal's external identity provider (IdP), from where it can be controlled or terminated. For example, a user can specify a function to be run on their behalf and terminated if their user account is deleted.
August 2021
Today, we are happy to announce the release of the following improvements to Cognite Data Fusion (CDF).
Manage RAW foreign table in the Postgres Gateway
You can now manage the RAW foreign table in the Postgres Gateway using APIs and don’t have to rely on external tools such as pgAdmin or psql CLI to create, list, update or delete the RAW foreign tables.
Update labels on assets
To make it easier to update labels on assets, we have added a set method in the updateAssets operation. The operation accepts a list of labels to set or replace for the resource.
Update sequence configuration
With the availability of mutable sequences, you can now update an existing sequence configuration. In addition to adding, removing and updating columns in your sequence, you can also update or clear the assetId, externalId, metadata, and the dataSetId for a sequence. To update a sequence, you need sequencesAcl:WRITE capabilities.
Group limits
To support authentication for users who are members of a large number of Azure AD groups we have increased the default group limit token configuration to 1.000 for new CDF projects with AAD as the IdP from now on.
Interactive engineering diagrams
We’re hard at work putting the final touches on our new user experience for working with interactive engineering diagrams. Stay tuned for the upcoming release.
Cognite Charts
The main new features in this Cognite Charts release are:
- Search for time series data by time series ID
- Highlights matches in search results
- Recently viewed tags and time series are displayed in the search panel
- Merge y-axes with the same units
- Show/hide min/max bands
- Show/hide gridlines
- Backend performance improvements
- Bug fixes & UI/UX improvements
Search for time series data by time series ID
We have added a tab in the search panel to search for “Time series ID,” specifically. This tab should be used when you know the name of the time series you are searching for (e.g. VAL_21_PT_1019_04:Z.X.Value), while the “Tag number” tab should be used to search for the asset tag to which the time series of interest is related (e.g. 21PT1019). You will also notice that search results that match your query are now highlighted to make direct matches easy to see.
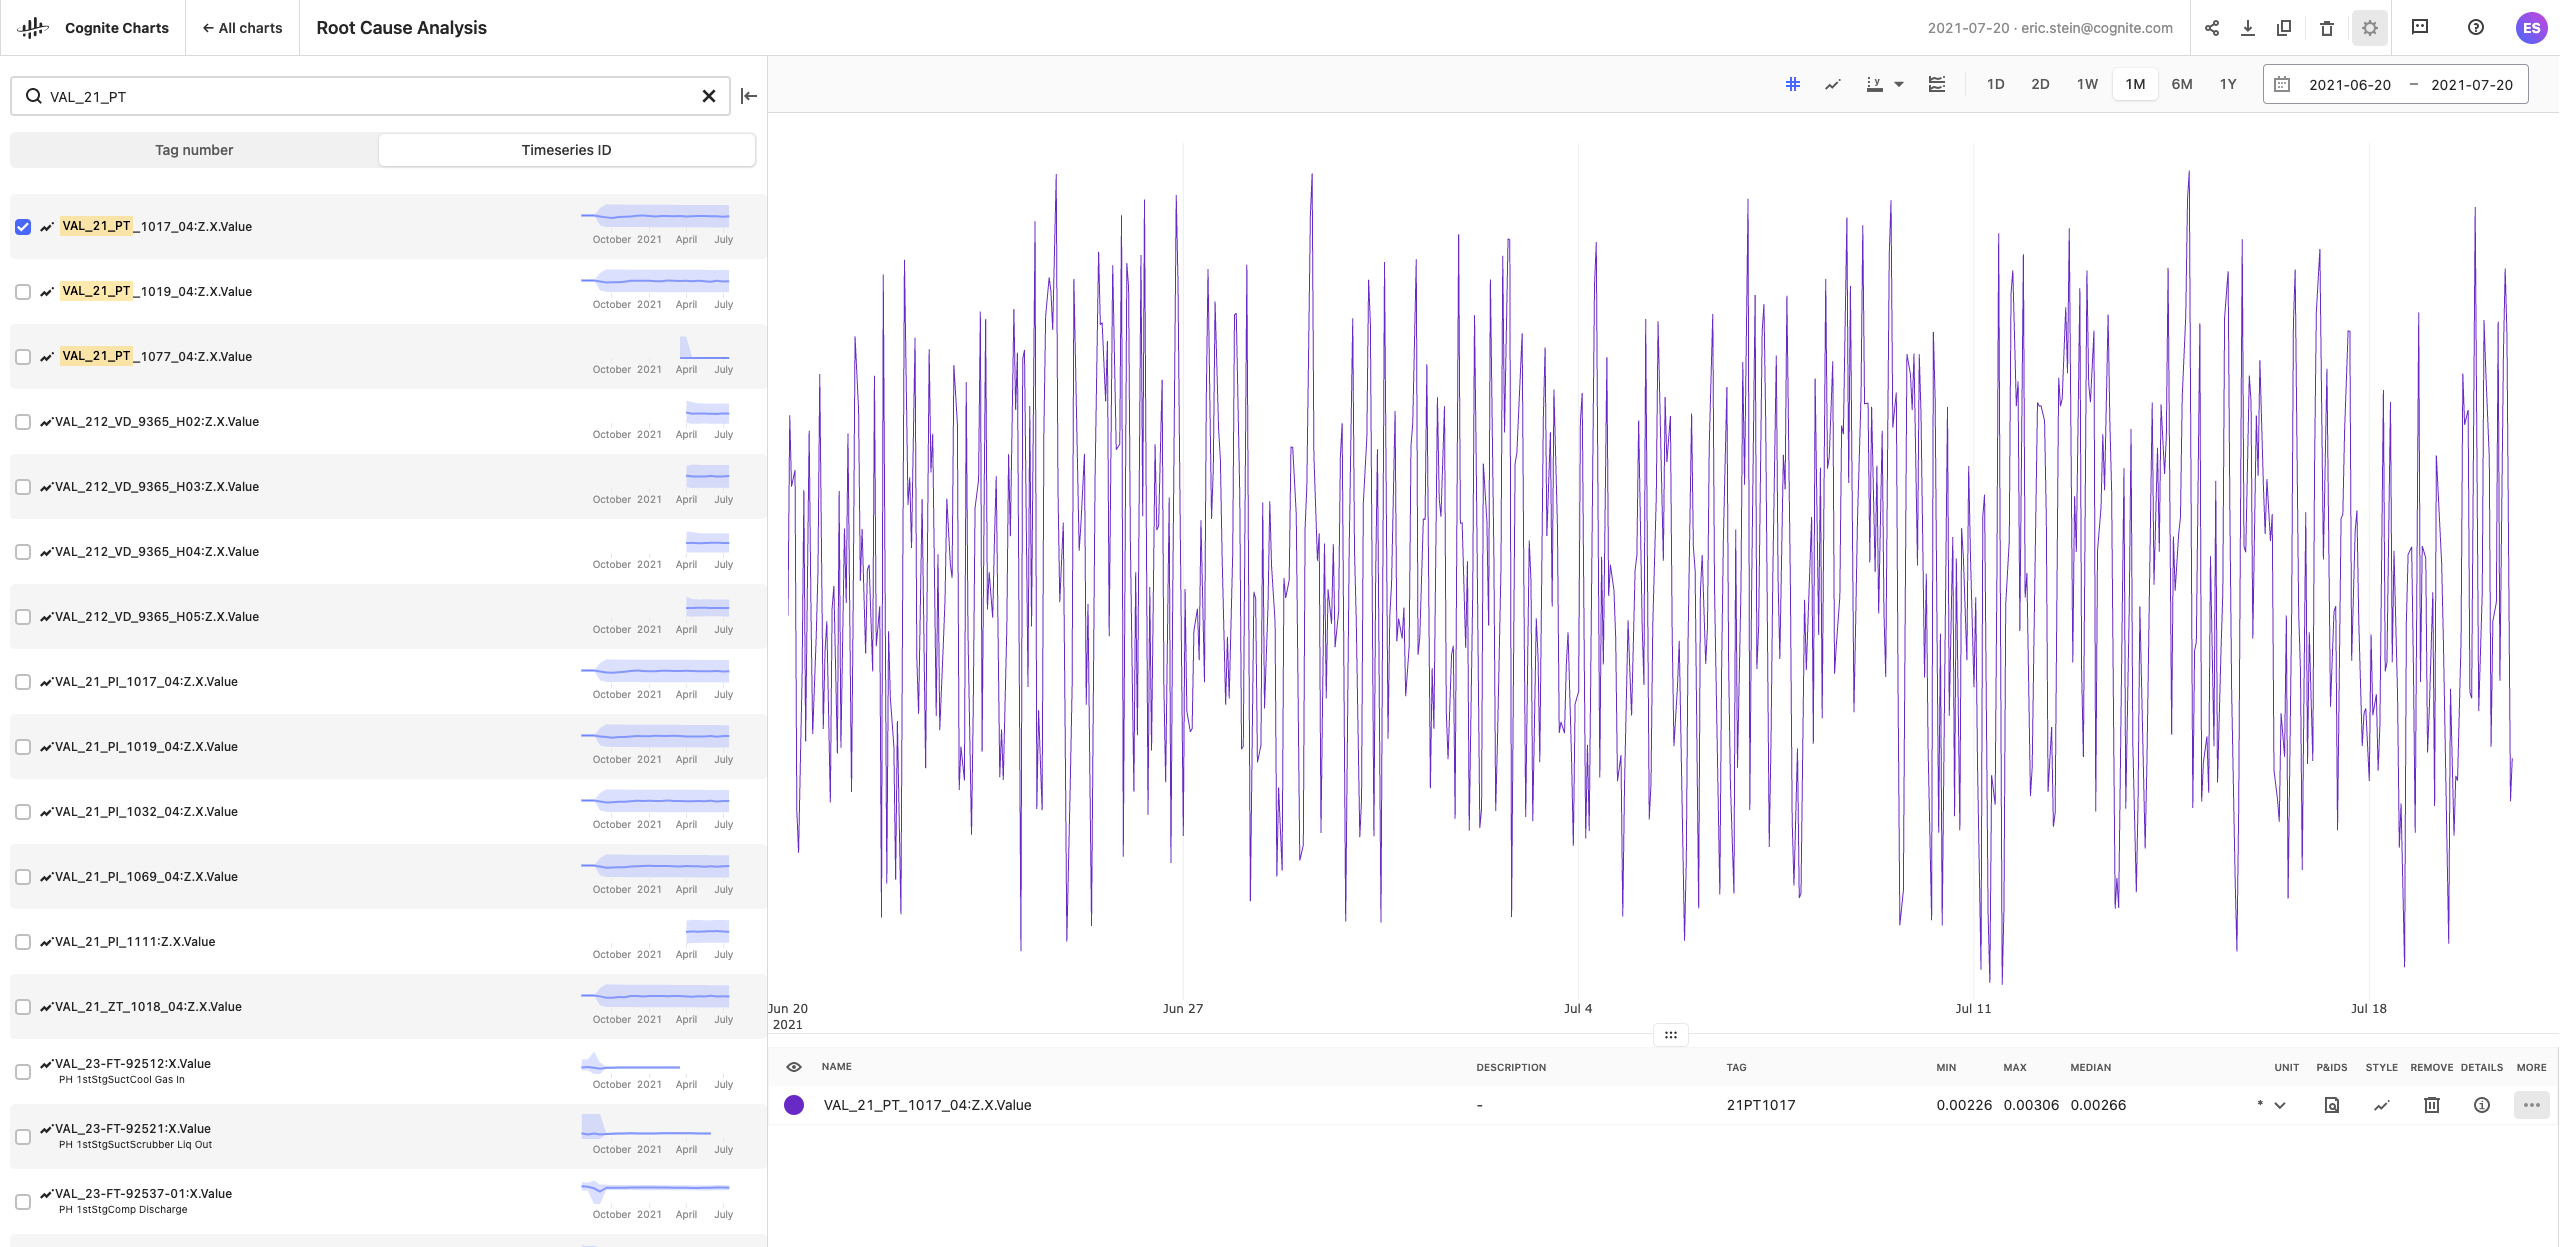
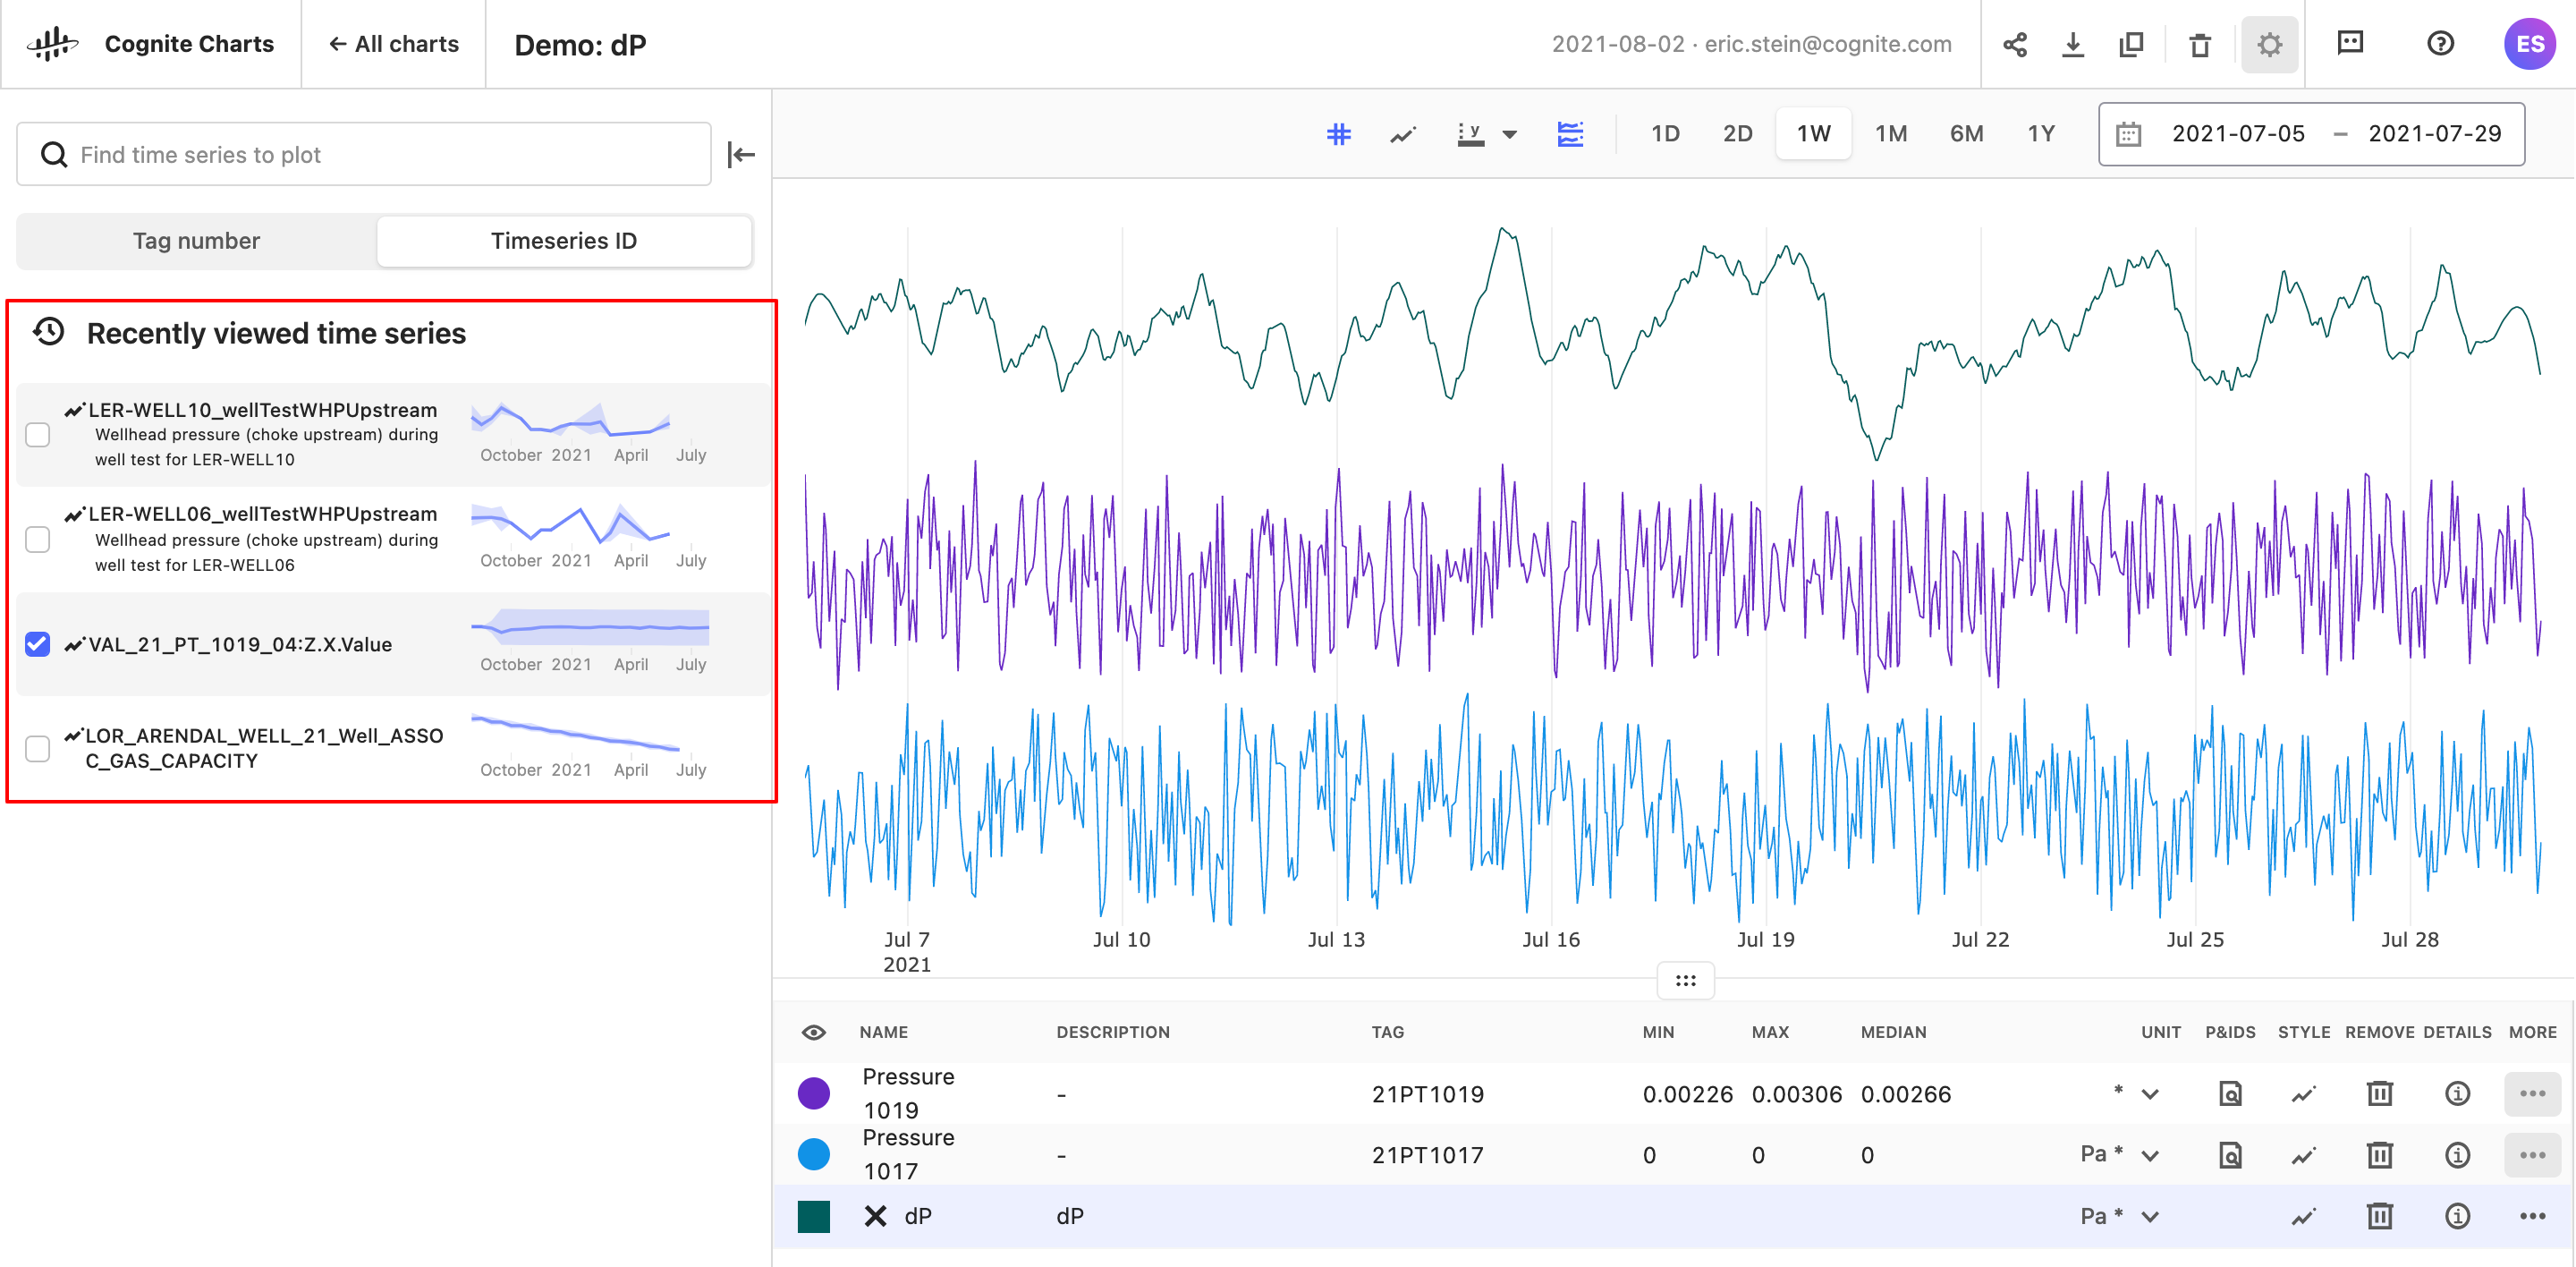
You’ll also see the tags (assets) and time series you have recently viewed (added and/or removed from your chart) in the search panel, if you have not begun to type a search query.
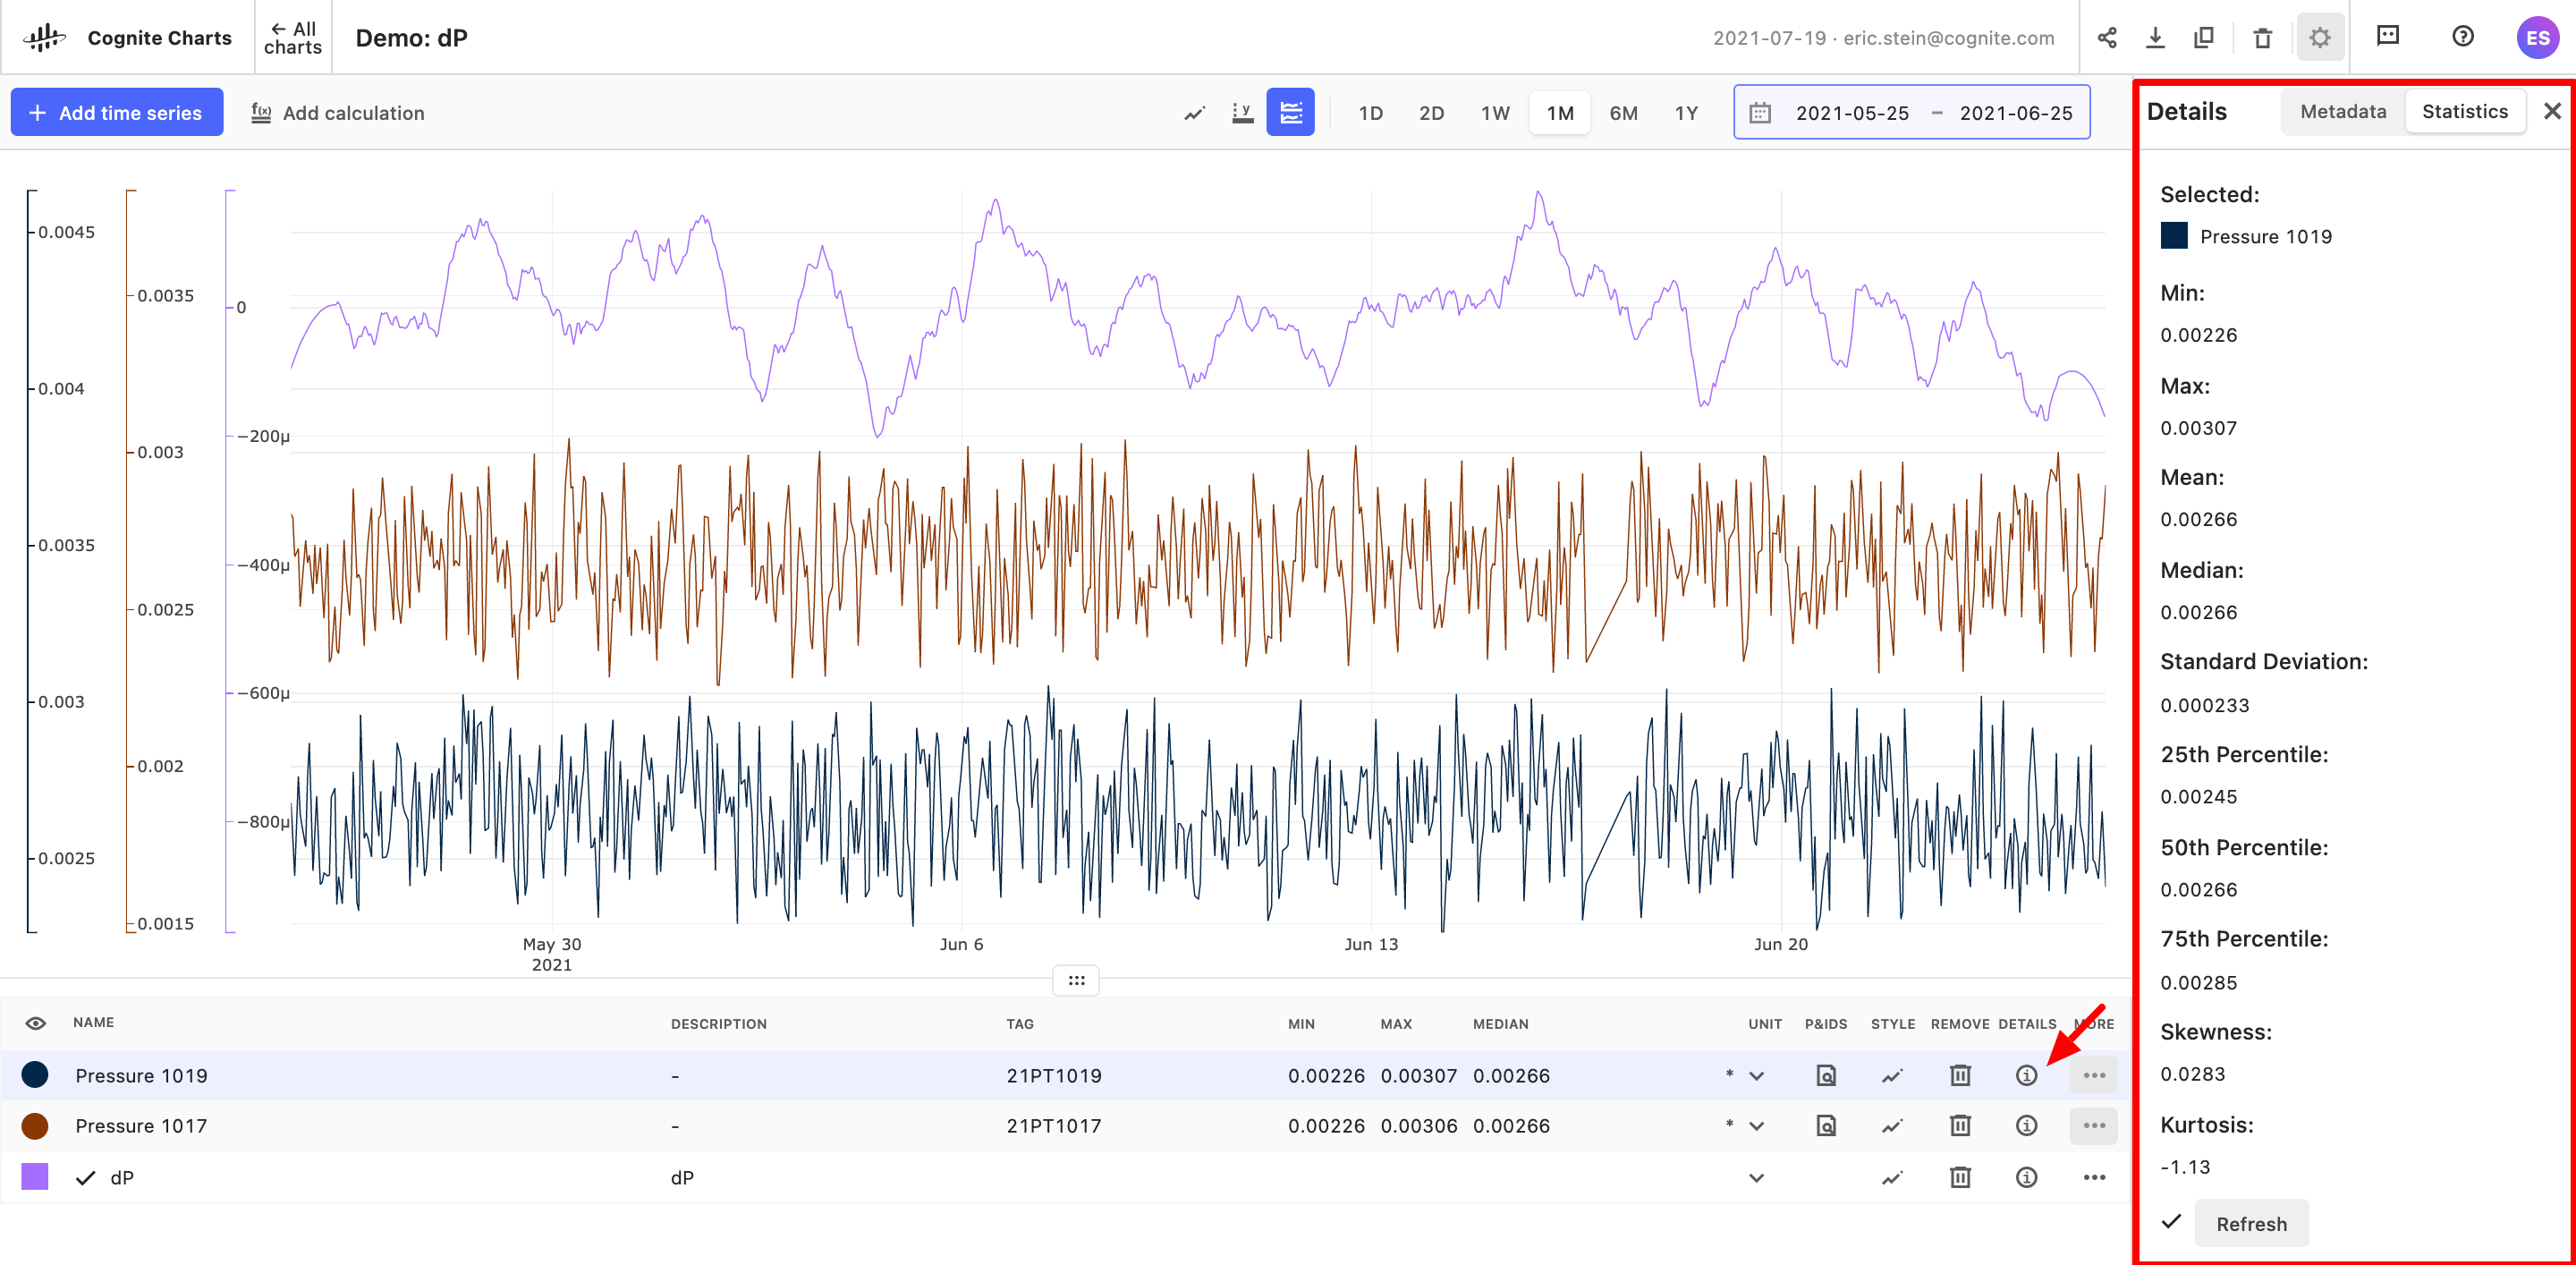
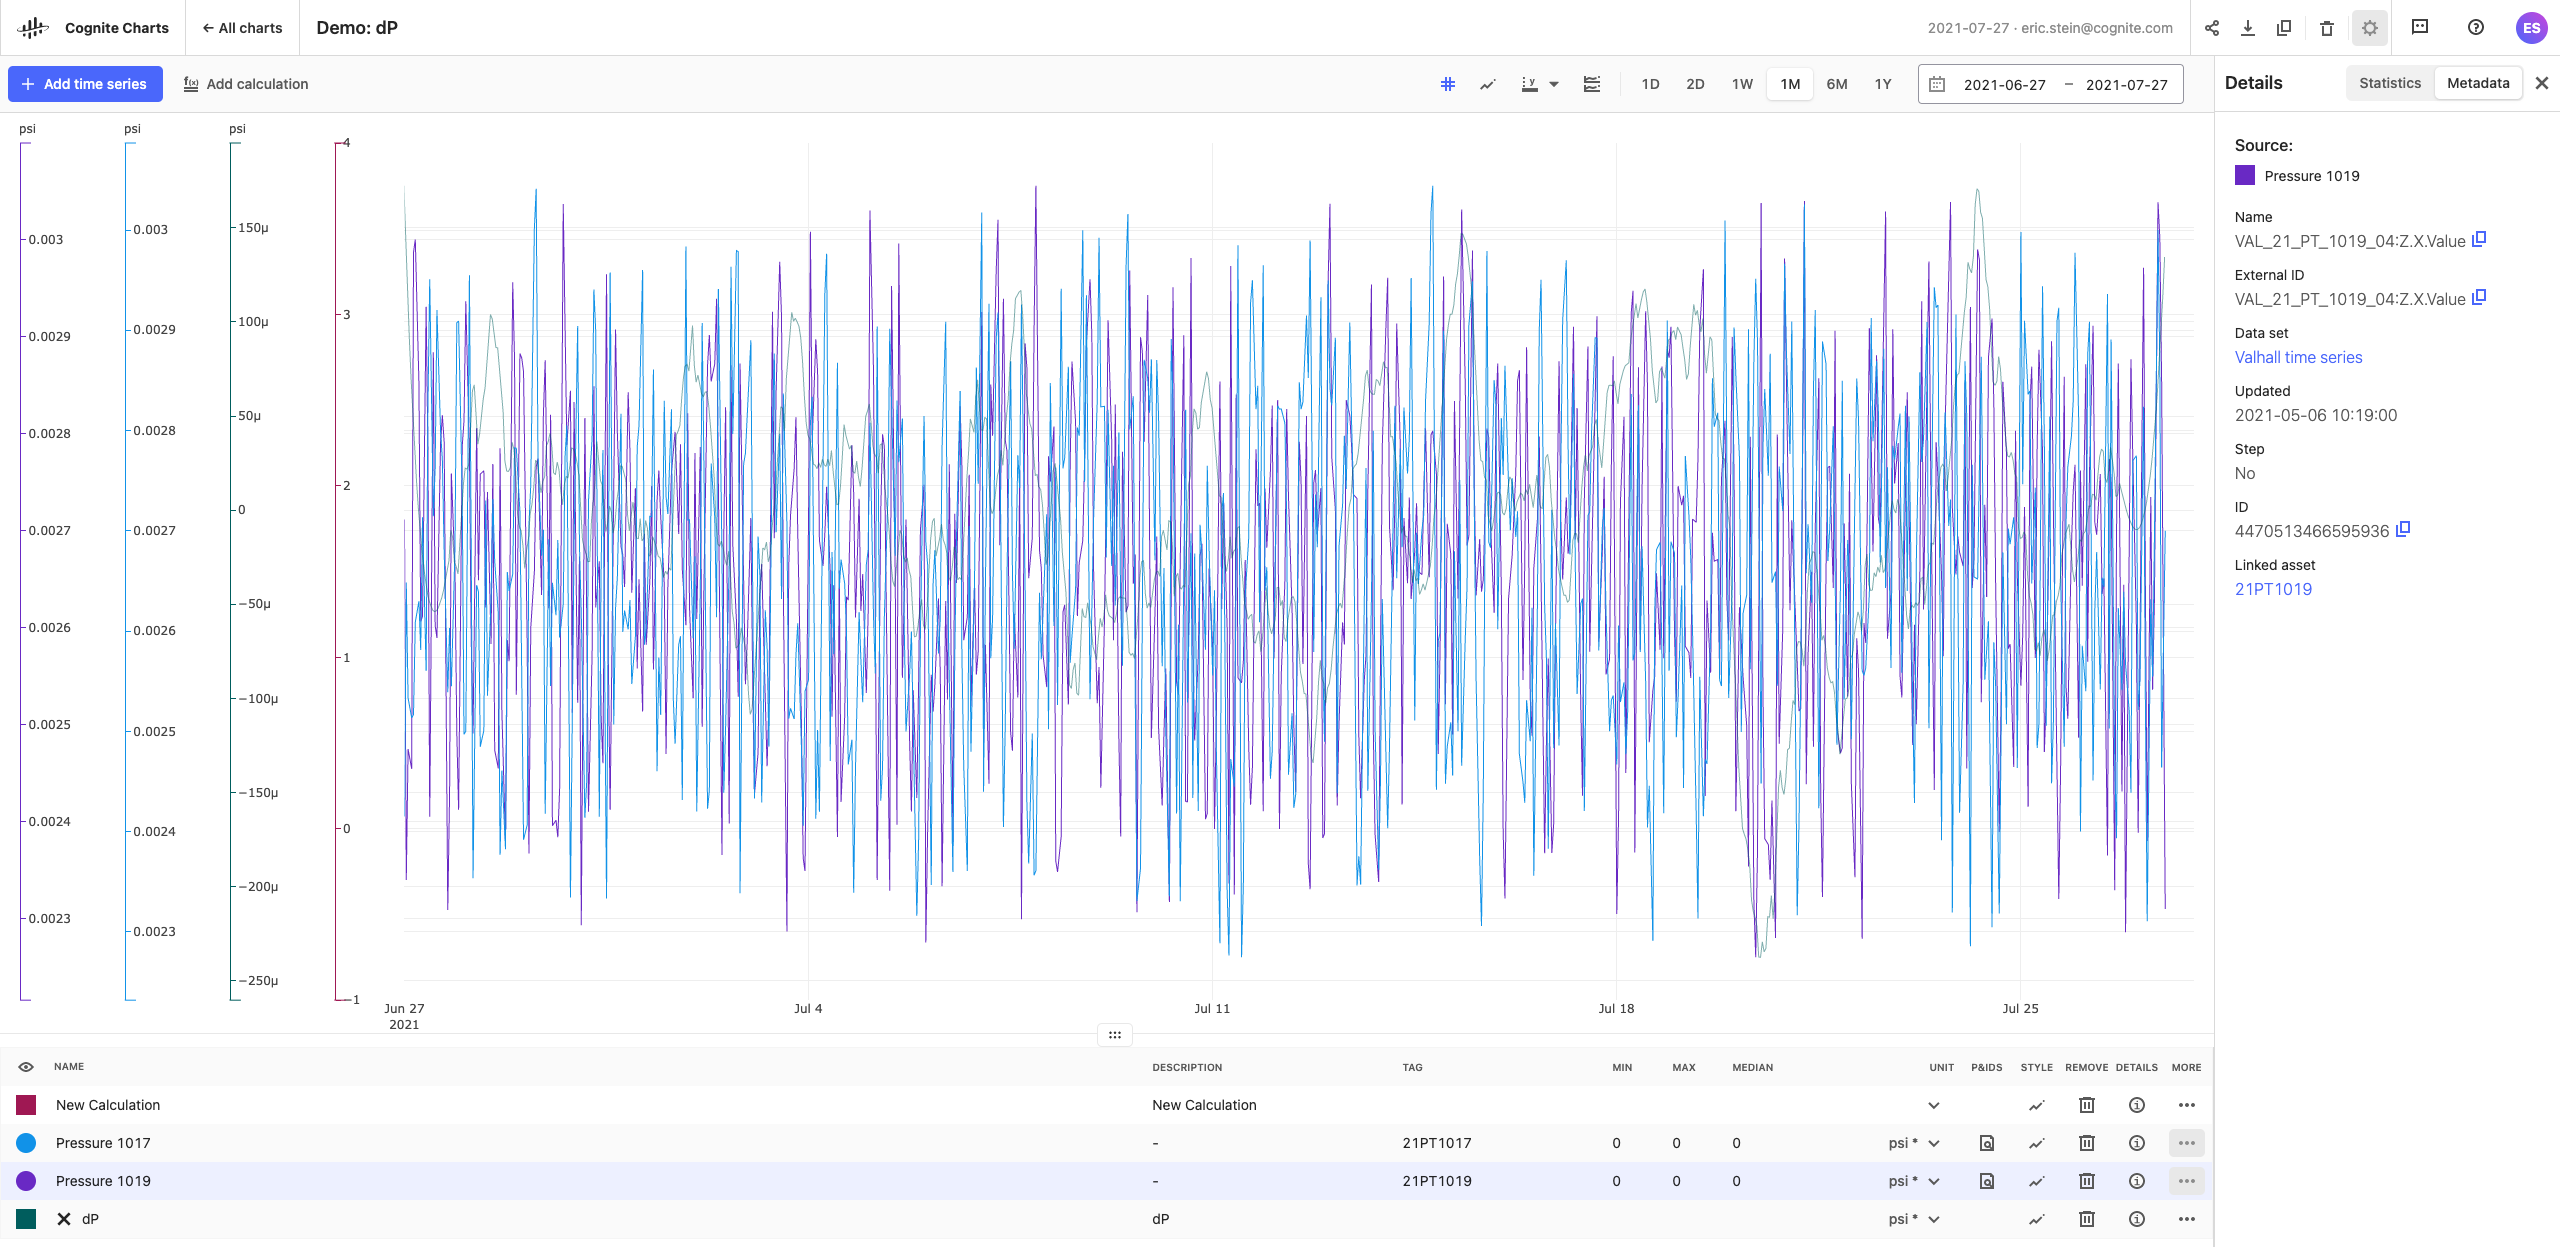
Basic Statistics & Tag Metadata
Users can view additional basic statistics (mean, std. dev., etc.) for the a given time series for the time range they’re currently viewing in the chart by clicking on the corresponding information icon. By clicking on the “Metadata” tab in this panel on the right-hand side of the screen, can view the metadata information.
Merge y-axes with same units
It’s now possible to easily compare the values of two or more time series or calculations that have the same unit, without needing to manually match and align the axes individually. Simply click the y-axis button found just above your chart and select the “Merge units” toggle. In order for this feature to work, you must have already assigned the input and output units on the time series or calculation(s) of interest.
Show/hide min/max bands
While looking at a wider range of time, Charts will show the aggregated values for a given time series. With the min/max bands, it’s possible to visually display the min and max range for a time series.
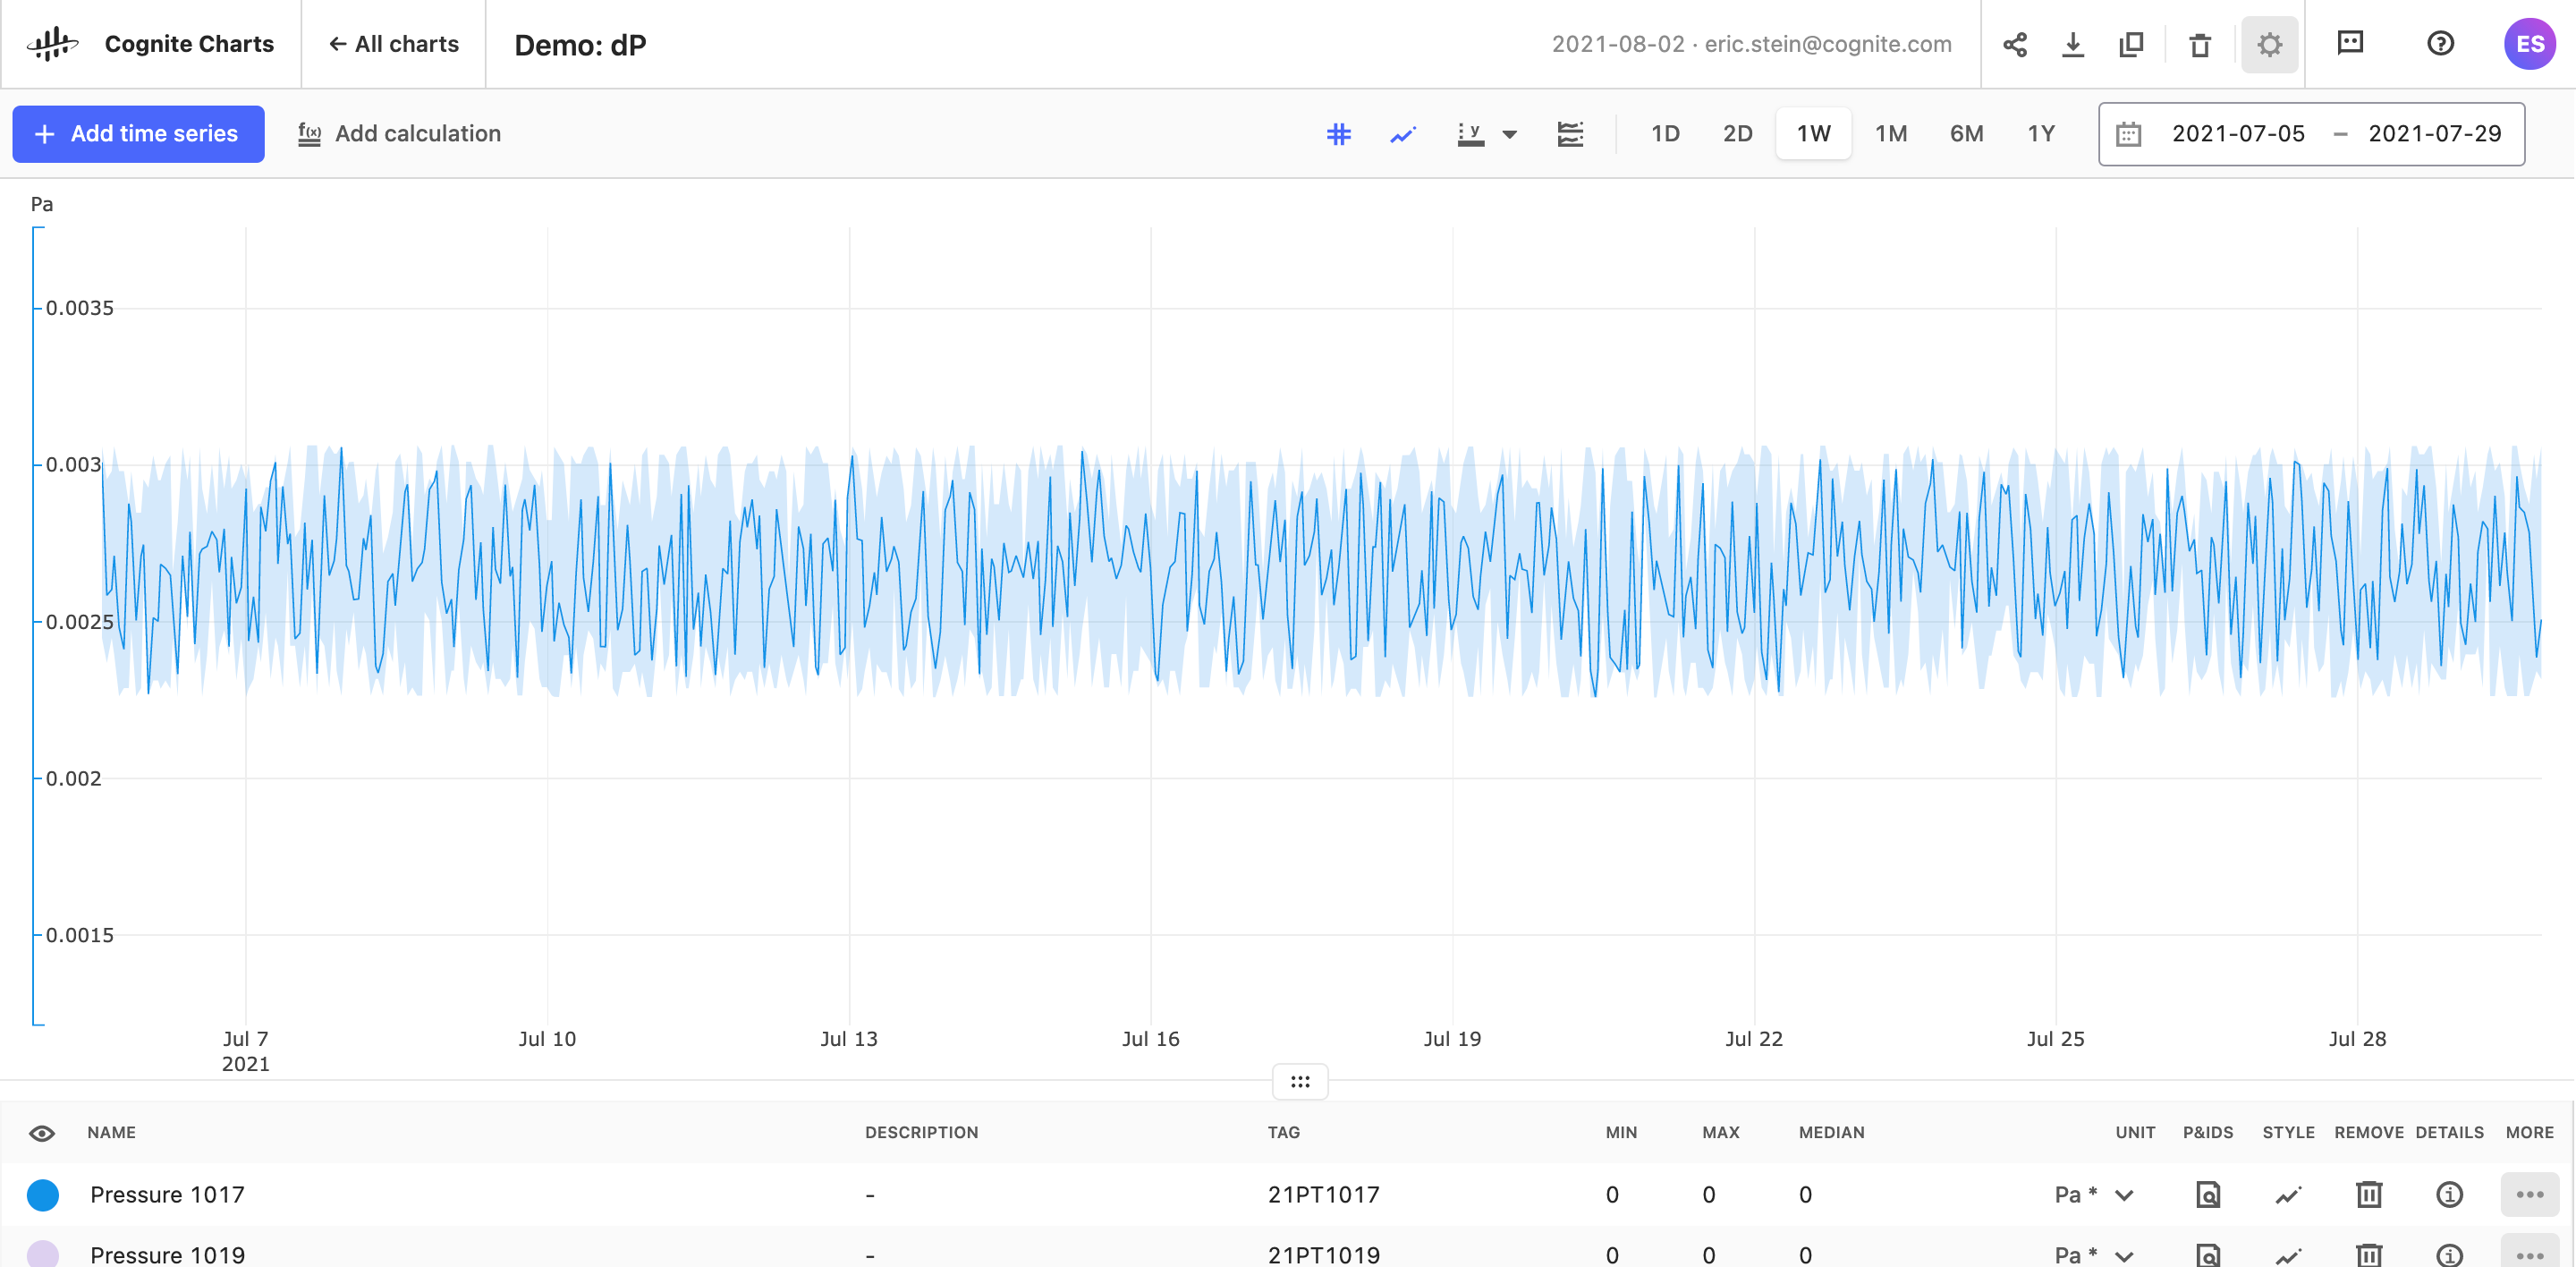
Show/hide gridlines
Gridlines can be a valuable way to visually identify time series values, but they could also get in the way and be confusing when you have a lot of time series data on your Chart. Use the show/hide gridlines toggle to decide for yourself whether or not you want them displayed on your chart.
June 2021
In his release we are adding a PostgreSQL gateway to stream data into CDF from your existing ETL solutions or push data directly to the gateway from extractors that support Postgres.
CDF Transformations now support OpenID Connect
You can now use OpenID Connect and your existing identity provider (IdP) framework to manage access to CDF Transformations securely. We currently support Azure AD, Microsoft's cloud-based identity and access management service.
When you have registered CDF Transformations in Azure AD, users can sign in with their organizational ID to transform data in a CDF project.
You can update existing transformations that are currently using API keys to use OIDC client credentials instead.
NOTE: CDF projects running in Google Cloud Platform need to be added to an allowlist (sometimes called a whitelist) to support scheduling of transformations using OpenID Connect. Contact your Cognite representative to be added to the allowlist.
Learn more in Setup and administration with OpenID Connect.
PostgreSQL gateway
Use the PostgreSQL gateway to ingest data into CDF from popular ETL solutions. The CDF resource types appear as tables in the PostgreSQL database and you can ingest data directly into CDF resources like assets, events and datapoints and to Cognite RAW.
- We currently support Azure Data Factory as the ETL tool.
- The PostgreSQL Gateway is intended for ingestion only. We do not support querying data from CDF using the gateway.
Grafana - nested variables
In Grafana, you can now link variables and use the value of one variable as input to another.
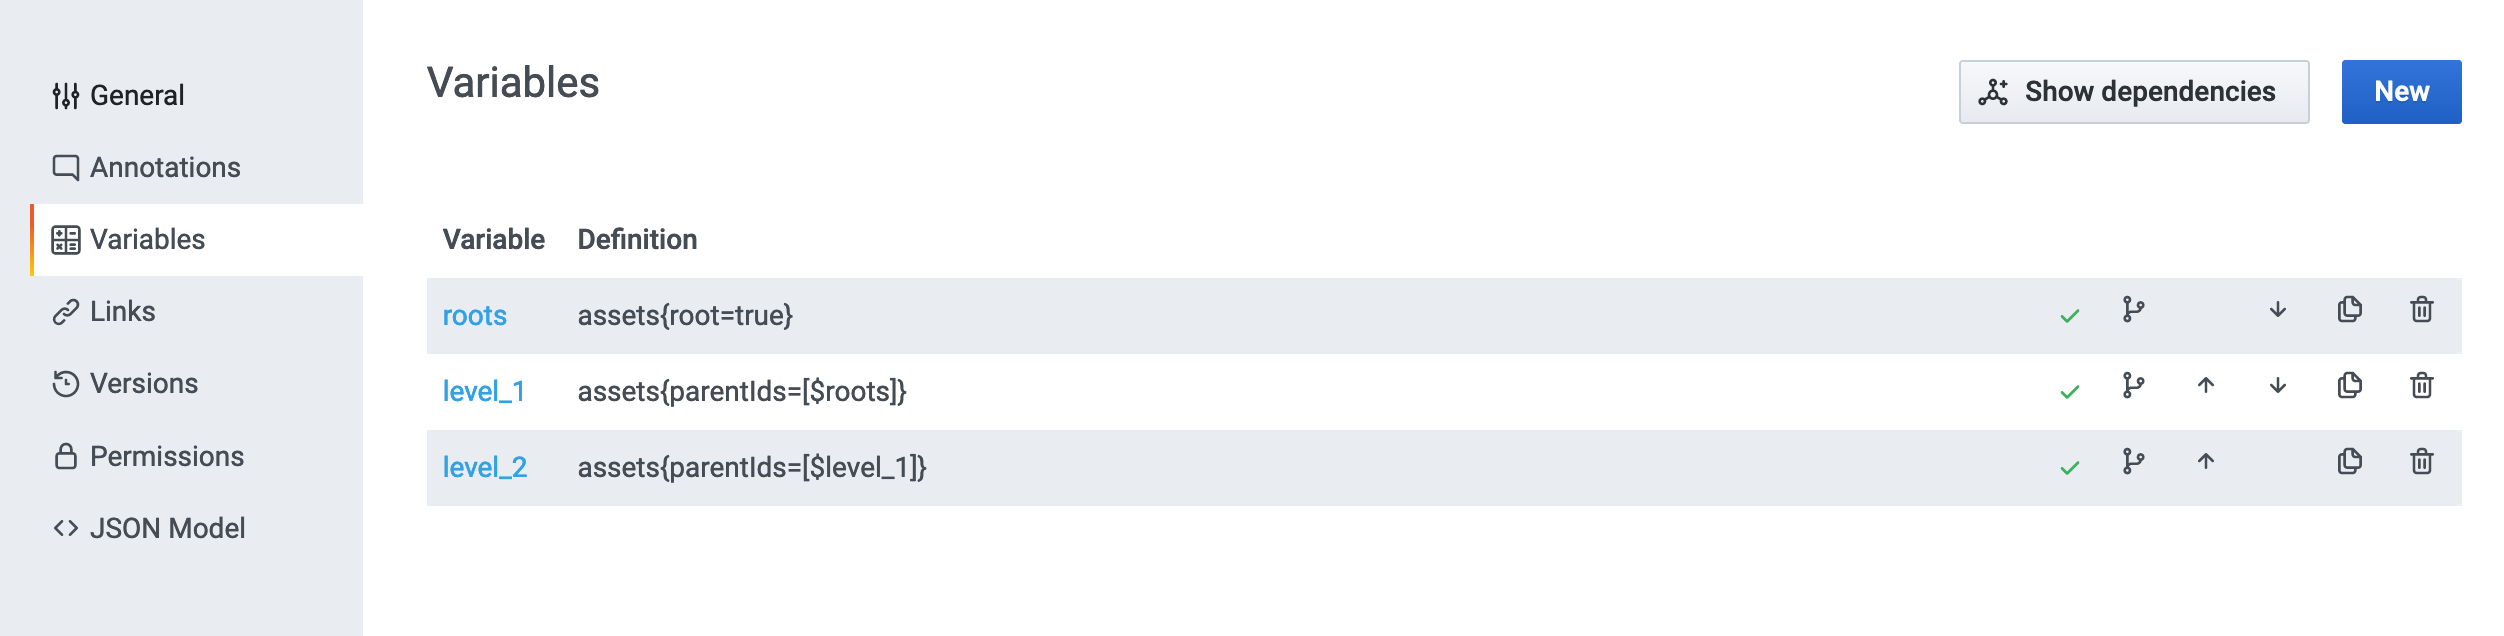
Learn more: Nested (chained) variables
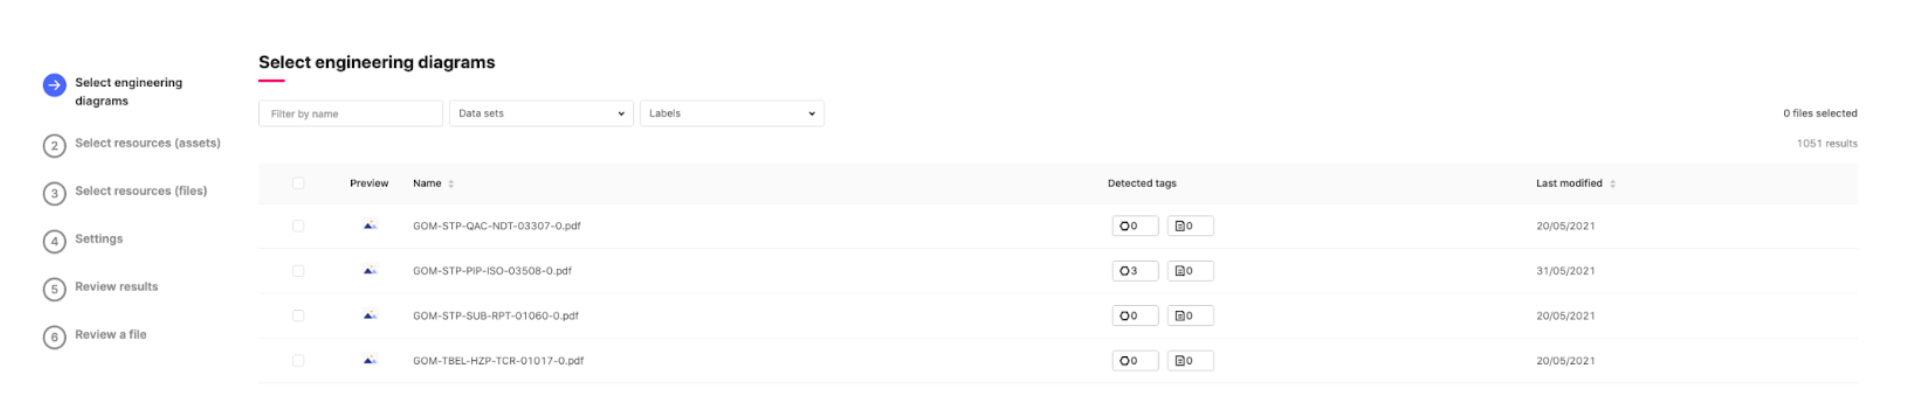
Sneak peek at the new interactive diagrams experience
We’re excited to give you a sneak peek of the latest redesign and enhancements to the interactive diagrams experience before it’s released publicly.
Power BI - templates
We have added support for Templates in Power BI to early adopters. Contact your Cognite representative to give it a try and share your feedback!
April 2021
This release of Cognite Data Fusion (CDF) focuses on the end-to-end data journey with fast and secure authentication to all Cognite applications using your organization's IdP. We currently support Microsoft'sAzure Active Directory (Azure AD). Speed up the time spent getting value for operations using a new sample function for contextualization and add events to a Grafana dashboard for visualizing and analyzing your CDF data.
Manage access with OpenID Connect
Register the CDF portal application and other Cognite applications in your IdP (Identity Provider) and use OpenID Connect and your IdP framework to manage user and service principal (app) identities securely. We currently support Microsoft's Azure Active Directory (Azure AD).
Visit the Manage access to CDF getting started course to learn more about the basic authentication concepts and terminology, secure access to CDF, and the different ways an application can access CDF data. Explore the docs for the technical details.
With the introduction of OpenID Connect and the IdP framework to manage CDF access securely, we strongly encourage customers to adopt the new authentication flows as soon as possible.
SQL Transformations CLI and Cognite Extractors support OpenID Connect authentication
Transformations CLI users, scheduled transformation jobs, and Cognite extractors can now authenticate using OpenID Connect and Azure AD.
Accelerate data set contextualization
Speed up your contextualization with the entity_matching.suggest.fields function. Supply the function with data samples to return suggested fields you can use for entity matching in the API, SDK, or UI.
Use existing matches to automatically generate matching rules to apply to all your data.
Add input naming variations to the entity matching model to improve the suggested matches, for example, pmp for pump and bhp for bottom hole pressure. To create a list of synonyms, use replacements in the API.
Visualize, track, and analyze events in Grafana
Boost your insights by adding the CDF events resource type to your Grafana dashboard. To visualize events, you can customize the time range and events to display and rename and organize columns according to your needs.
By default, the events annotation query returns events that are active within a time range, but you can customize the query with additional time filters.
Learn more: Visualize events
Templates (Early adopter program)
With Templates, you build your view of the data you have available in CDF and simplify the applications and solutions you are working on by accessing data through templates. Templates remove the gap between the application’s data model and the preexisting structure of the relevant data. It is easy to scale your solution across more data without changing or redeploying your application code or configuration. Instead, you can work with your template in CDF, and use the tooling available to scale to more data with governance.
Learn more: Manage templates
Charts (Early adopter program)
Use Charts to explore, trend, and analyze industrial data. Find, understand, and troubleshoot for actionable insights from time series and contextualized P&IDs already in the CDF portal application or other Cognite applications then share the chart for collaboration. Charts runs securely with a single, secure sign-in.
Learn more: Get started with Charts
To join an Early Adopter program, contact your Cognite representative.
February 2021
This release of Cognite Data Fusion (CDF) focuses on on usability improvements across CDF as well as laying the foundation for existing future features. We are also very proud of our Cognite Power BI Connector, which is now certified by Microsoft.
The Cognite Power BI Connector is out of Beta
We're excited to announce that Microsoft has certified the Cognite Power BI Connector and that the connector is now out of Beta. The Cognite Power BI Connector enables data consumers to easily read, analyze, and present data from Cognite Data Fusion (CDF) in compelling visualizations in Power BI Desktop and the Power BI service.
You can find the connector in the Other category of the Get Data dialog in Power BI. Learn more in our in-depth article.
Enrich contextualized assets with 3D models
Increase the value outtake of contextualization by connecting assets to a 3D model with the new easy-to-use option under Match entities in the CDF user interface. Visually inspect assets and zoom into details to get tangible information.
Learn more: 3D contextualization
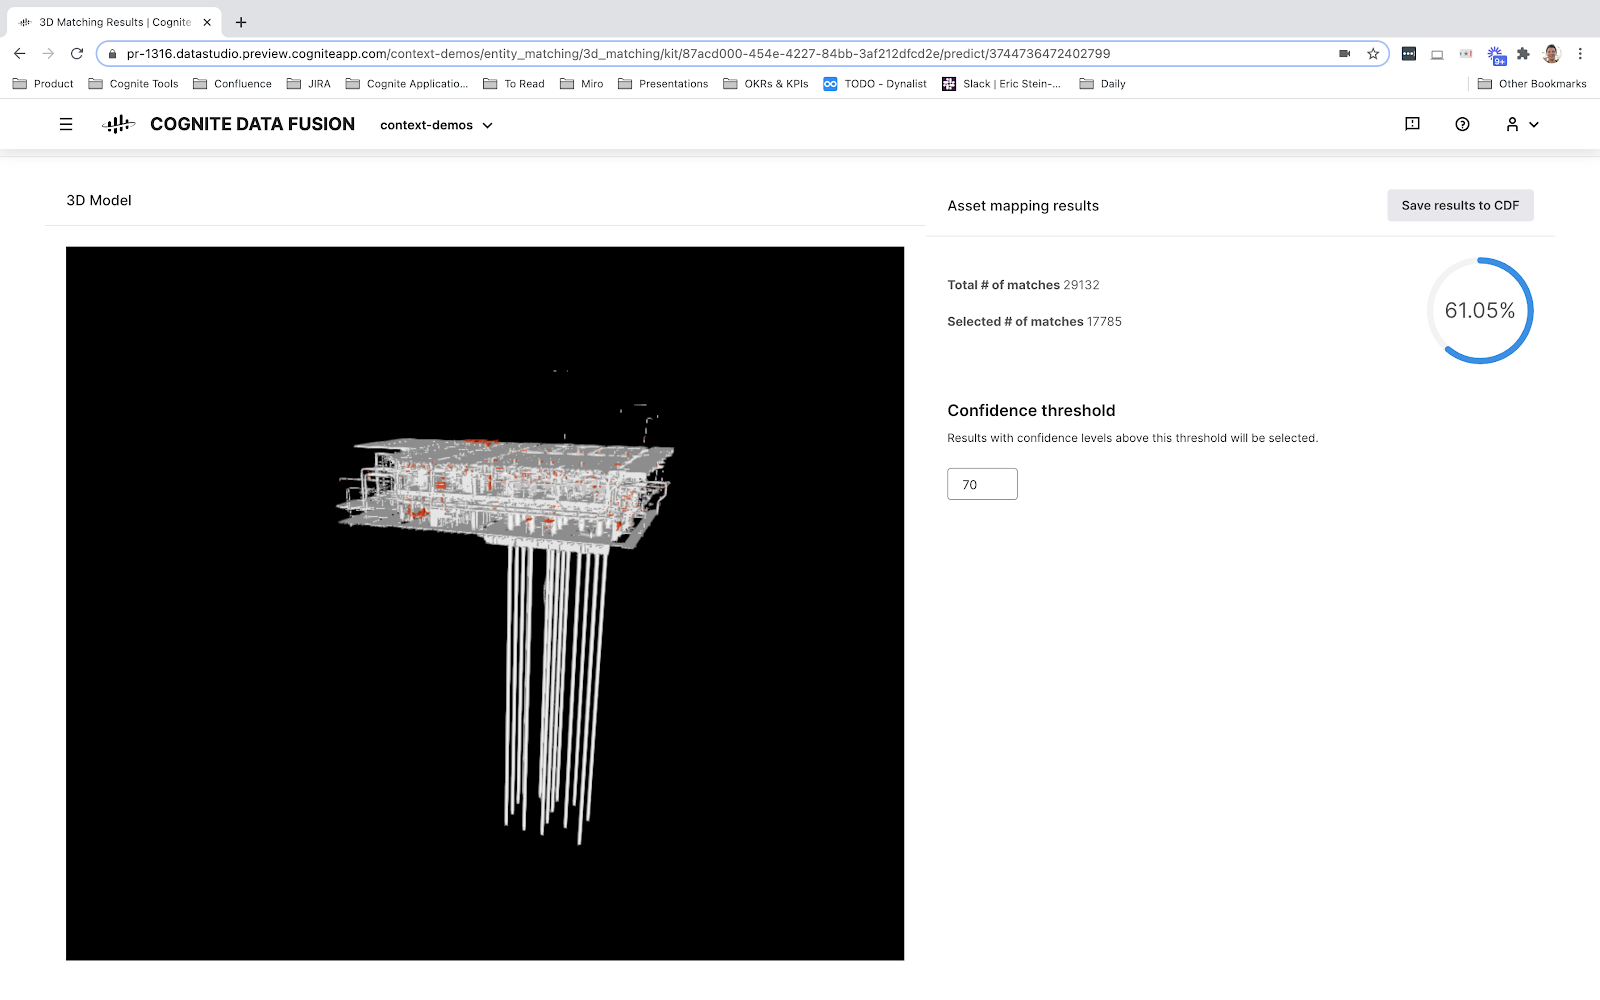
Accelerate finding and filtering relevant data
Finding the data you need is now even easier in the CDF Data explorer. Navigate between different parts of CDF with the new drop-down navigation in the top bar and shift between multiple CDF resources with more descriptive tab names.
Use the new Quick search in the top navigation to search for the resource names and explore data from anywhere in CDF. Filter on metadata and hide the empty fields for any resource and show aggregated values of metadata keys for assets to get unique values ordered by frequency (if enabled in the API). You'll also notice that date points are added to the time series sparkline to better visualize missing data for a given range.
Learn more: Data explorer
Labels and relationships in SQL transformations
Create and delete data related to the Relationships and Labels resource types when you use SQL queries in CDF Transformations to transform data from the CDF staging area into the CDF data model.
Learn more: CDF Transformations
Enhanced results page for entity matching pipelines
Get more information about the results, rules, and rule conflicts for matches from your Entity matching pipelines in CDF and improve rule predictions by selecting particular matches to CDF.
Learn more: Entity matching
December 2020
This release focuses on improving access and discoverability of data and workflow automation. Cut down on time you spend trying to find data, make sense of it, and then deploy and monitor it. We deliver tools to speed up this process and allow you, the user, to compound the value of your work. Improved performance and capabilities for your digital teams means a faster time to value for operations.
Explore and discover the right data for your solutions
Use the CDF Data Explorer to find, validate, and learn about the data you need to build solutions. Browse through all the available resource types in your CDF project and drill into details and linked resources, for example, assets and time series with live data, interactive P&IDs, and mapped events.
Learn more: CDF Data Explorer
Configure and rerun contextualization pipelines
Create a pipeline to re-run matching models on data sets. If the data set receives new data, you can re-run the pipeline to find additional matches.
Learn more: Entity matching
Enrich files with geographic location
The new geoLocation field for the Files resource type lets you contextualize and find documents or files related to geographic locations. For example, find seismic reports for an area or drone survey photos from a yard section.
Learn more: Geographic location of files
Monitor your SQL transformations
Subscribe to email notifications to monitor the transformation process and solve any issues before they reach the data consumer. You can add up to 5 email addresses, either to groups or to specific people.
Flexible data modeling with relationships
This release sees the relationships resource type moving from Beta to API v1.
While you can use the assets resource type to model equipment relations as a tree, relationships let you model data in additional graph structures meaningful for your organization.
Data engineers can use relationships to organize assets into multiple structures. For example, you can order assets by the process flow or the physical connectivity in a grid structure to let users efficiently locate data for nearby equipment.
Some users in your organization may find it useful and efficient to organize the equipment by its function in a maintenance hierarchy. Others may benefit from having the equipment organized by physical location in a location-based hierarchy:
See Modeling asset structures with relationships for more examples.
Beyond structuring assets, you can use relationships to create richer connections between data elements and build a knowledge graph on top of the existing data.
To learn more about how relationships can represent industrial reality, we recommend reading the "Building a contextualized power system network model" whitepaper.